
DY0-001 · Question #41
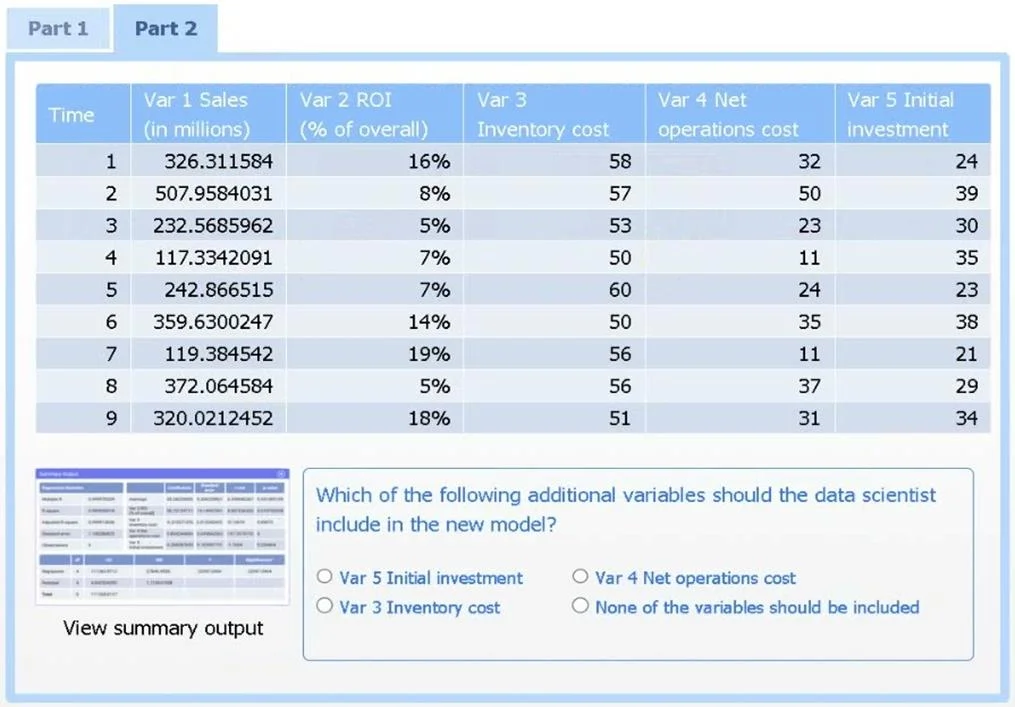
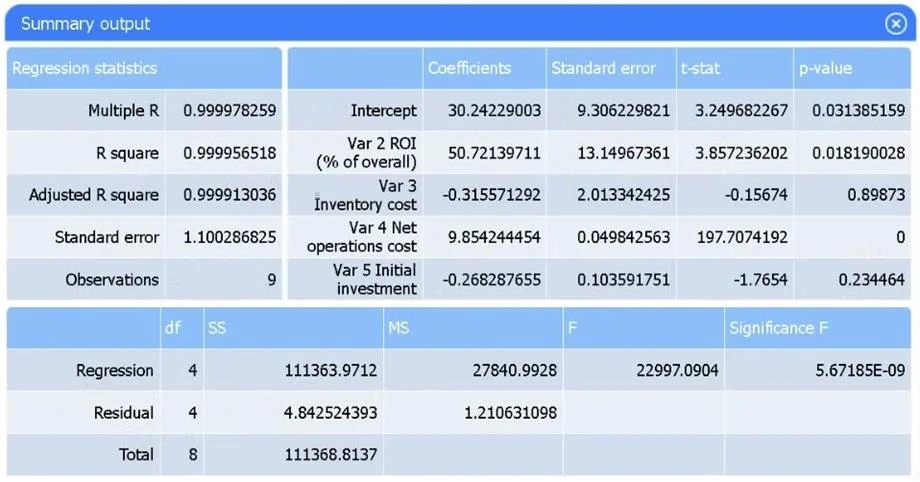
SIMULATION 2 A data scientist needs to determine whether product sales are impacted by other contributing factors. The client has provided the data scientist with sales and other variables in the…
The correct answer is C. Linear regression R² 0.8. C is correct because R² measures the proportion of variance in sales explained by the model - a higher R² means better fit, and linear regression's R² of 0.8 outperforms all alternatives. A (Ridge, R²=0.5) is wrong because Ridge regression adds L2 regularization to penalize…
Question
Exhibits
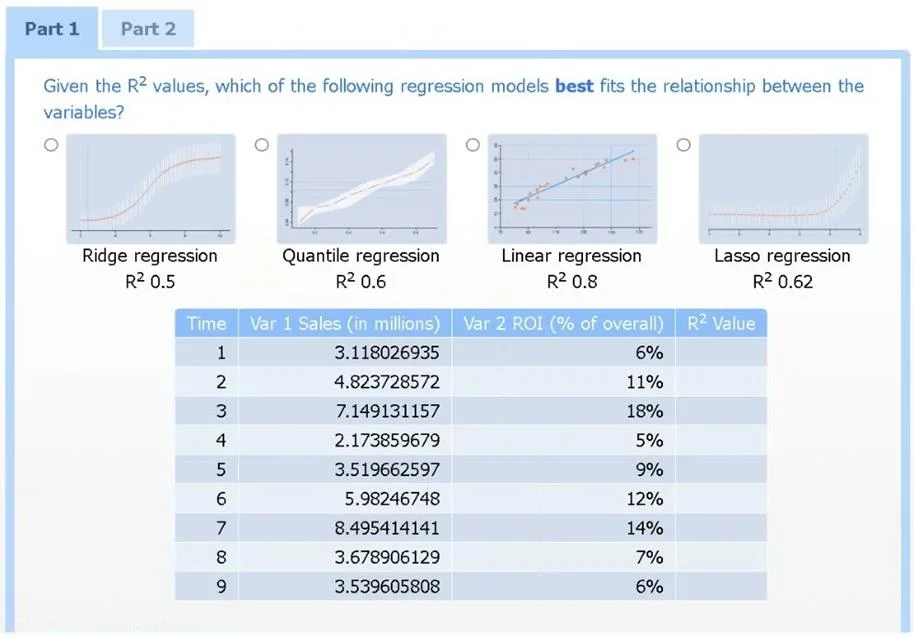
Options
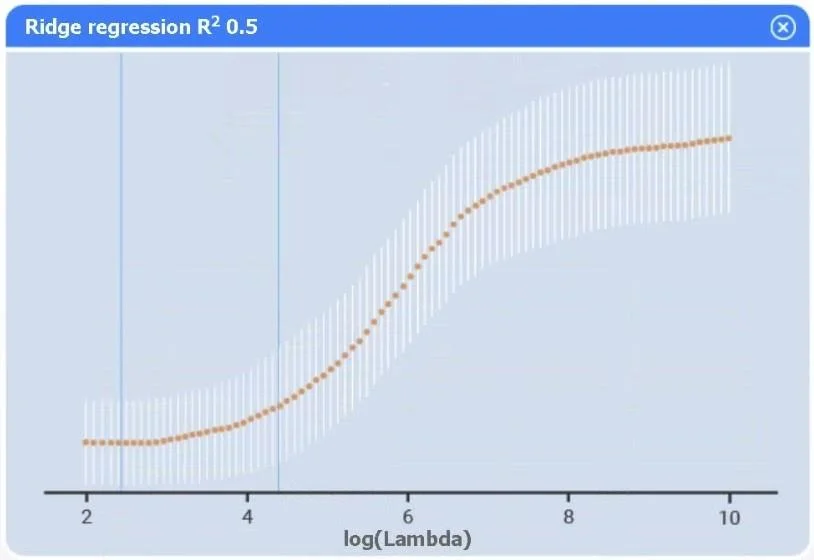
- ARidge regression R² 0.5
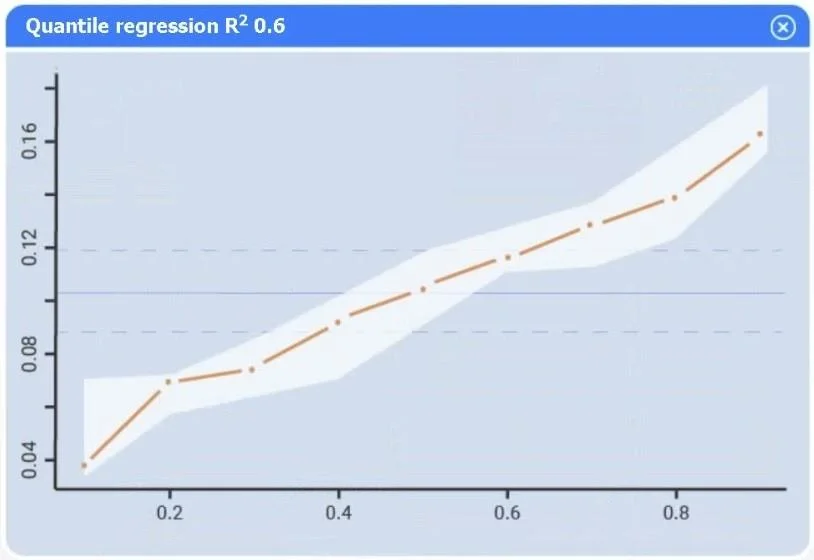
- BQuantile regression R² 0.6
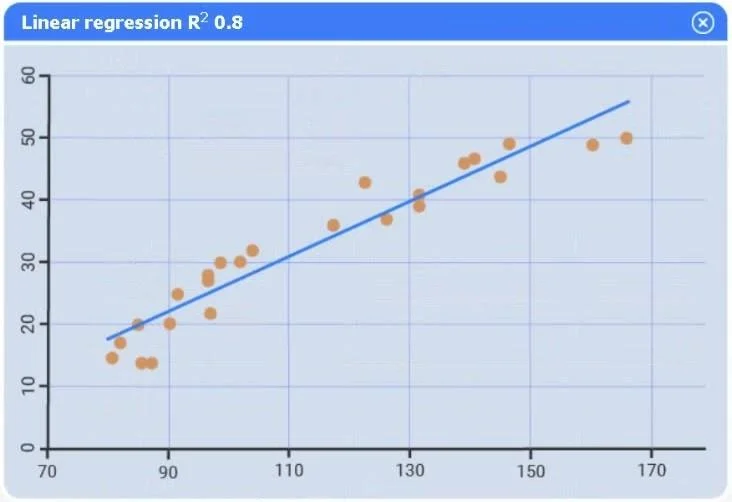
- CLinear regression R² 0.8
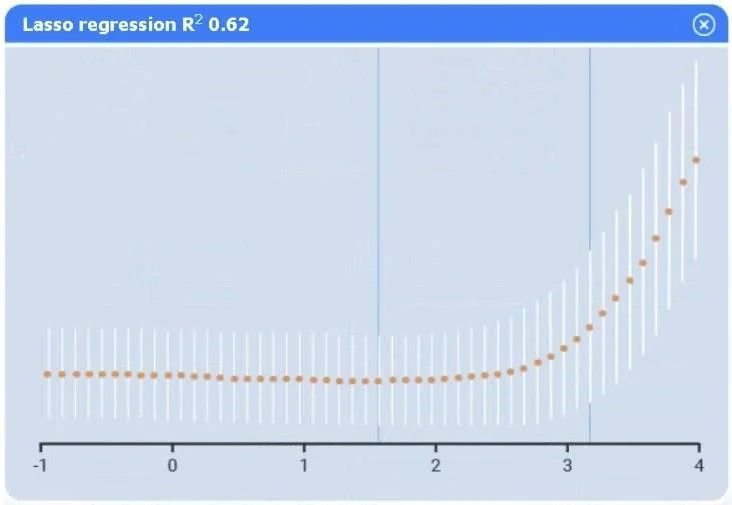
- DLasso regression R² 0.62
How the community answered
(46 responses)- A20% (9)
- B7% (3)
- C63% (29)
- D11% (5)
Explanation
C is correct because R² measures the proportion of variance in sales explained by the model - a higher R² means better fit, and linear regression's R² of 0.8 outperforms all alternatives. A (Ridge, R²=0.5) is wrong because Ridge regression adds L2 regularization to penalize large coefficients, which sacrifices explanatory power and is better suited for multicollinearity problems, not maximizing fit. B (Quantile, R²=0.6) is wrong because quantile regression models conditional medians or percentiles rather than the mean, making it useful for skewed data or outliers - not the best choice when overall variance explanation is the goal. D (Lasso, R²=0.62) is wrong because Lasso adds L1 regularization that forces some coefficients to zero for feature selection, again trading fit for sparsity unnecessarily here.
Memory tip: Think "R-squared = Right model" - when comparing regression models for explanatory power with no stated reason to regularize, always pick the highest R².
Topics
Community Discussion
No community discussion yet for this question.