
DP-300 · Question #142
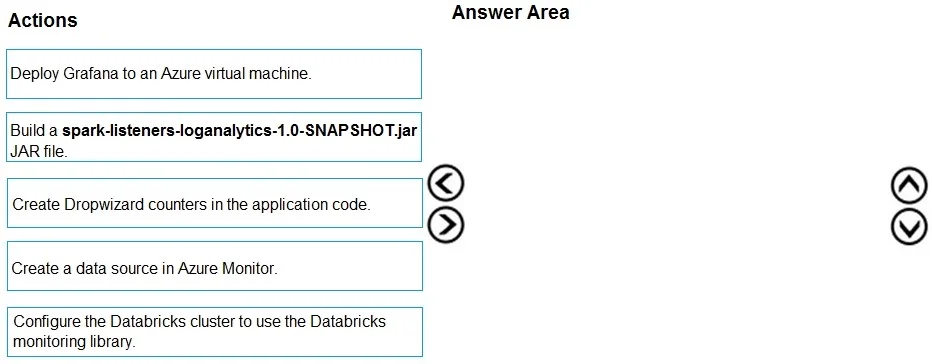
Drag and Drop Question Your company analyzes images from security cameras and sends alerts to security teams that respond to unusual activity. The solution uses Azure Databricks. You need to send…
The correct answer is Configure the Databricks cluster to use the Databricks monitoring library.; Build a spark-listeners-loganalytics-1.0-SNAPSHOT.jar JAR file.; Create Dropwizard counters in the application code. To send Spark-level events, Structured Streaming metrics, and application metrics to Azure Monitor from Databricks, you must first configure the Databricks cluster to use the Databricks monitoring library (which sets up the pipeline to Azure Monitor/Log Analytics), then build…
Question
Exhibit
Answer Area
Drag items
Correct arrangement
- Configure the Databricks cluster to use the Databricks monitoring library.
- Build a spark-listeners-loganalytics-1.0-SNAPSHOT.jar JAR file.
- Create Dropwizard counters in the application code.
Explanation
To send Spark-level events, Structured Streaming metrics, and application metrics to Azure Monitor from Databricks, you must first configure the Databricks cluster to use the Databricks monitoring library (which sets up the pipeline to Azure Monitor/Log Analytics), then build the spark-listeners-loganalytics JAR file that contains the listener code needed to capture Spark events and stream metrics, and finally create Dropwizard counters in the application code to emit custom application-level metrics. This sequence establishes the infrastructure layer first, then the Spark integration layer, and finally the application-level instrumentation. Dropwizard metrics is the specific metrics library used by the Databricks monitoring solution to expose custom application metrics alongside the Spark framework metrics.
Topics
Community Discussion
No community discussion yet for this question.