
DP-100 · Question #24
Drag and Drop Question You need to visually identify whether outliers exist in the Age column and quantify the outliers before the outliers are removed. Which three Azure Machine Learning Studio…
The correct answer is Select Columns in Dataset; Summarize Data; Clip Values. The task requires a sequence of Azure Machine Learning Studio modules to first visually identify outliers, then quantify them, and finally prepare the data for removal, focusing on the 'Age' column.
Question
Exhibit
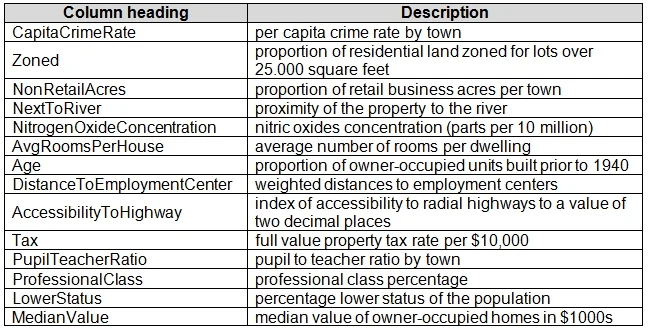
Answer Area
Drag items
Correct arrangement
- Select Columns in Dataset
- Summarize Data
- Clip Values
Explanation
The task requires a sequence of Azure Machine Learning Studio modules to first visually identify outliers, then quantify them, and finally prepare the data for removal, focusing on the 'Age' column.
Approach. The correct interaction is to drag and drop three specific Azure Machine Learning Studio modules into the answer area and arrange them in the following sequence:
-
Select Columns in Dataset: This module is used first to focus the analysis on the 'Age' column, as specified in the question. It helps narrow down the dataset to the relevant feature, which is a good practice for data processing workflows.
-
Detect Outliers: This module directly addresses the requirement to 'quantify the outliers'. It applies an outlier detection algorithm (e.g., based on IQR, PCA, or Z-score) to the selected 'Age' column, and typically adds a new column to the dataset indicating whether a row is an outlier and/or providing an outlier score. This fulfills the 'quantify' aspect.
-
Summarize Data: This module is used next. It takes the output from the 'Detect Outliers' module (which now includes the original 'Age' column and the new outlier information). When the output of 'Summarize Data' is visualized, it provides descriptive statistics, histograms, and box plots for the 'Age' column. By analyzing these visualizations alongside the outlier indicators added by 'Detect Outliers', a user can 'visually identify whether outliers exist' and understand their characteristics. This also keeps the data in a state 'before the outliers are removed', as 'Summarize Data' only analyzes without performing removal. This sequence ensures a logical flow where the column is targeted, outliers are quantified, and then the results are analyzed visually, all preceding the actual removal action.
Common mistakes.
- common_mistake. A common mistake would be to use 'Summarize Data' as the first step directly, followed by 'Detect Outliers'. While 'Summarize Data' is excellent for initial visual identification, its output is a summary report (statistics), not the original dataset. Therefore, 'Detect Outliers' (which requires a dataset as input) cannot directly follow 'Summarize Data' in a data processing pipeline. Other incorrect choices would involve modules unrelated to outlier analysis, such as 'Clean Missing Data' (for imputing missing values), 'Normalize Data' (for scaling data), or 'Remove Duplicate Rows' (for removing identical records). Using 'Apply Filter' or 'Split Data' as one of the three core modules for identifying and quantifying would also be incorrect because these modules typically come after outliers have been detected and are used for the actual removal or segregation, not for the initial identification and quantification steps specified in the prompt. If used, they would go beyond the 'before outliers are removed' requirement by performing the removal itself.
Concept tested. Data preprocessing and exploratory data analysis (EDA) techniques in Azure Machine Learning Studio, specifically focusing on outlier detection, quantification, and visualization for numerical features.
Topics
Community Discussion
No community discussion yet for this question.