
DP-100 · Question #172
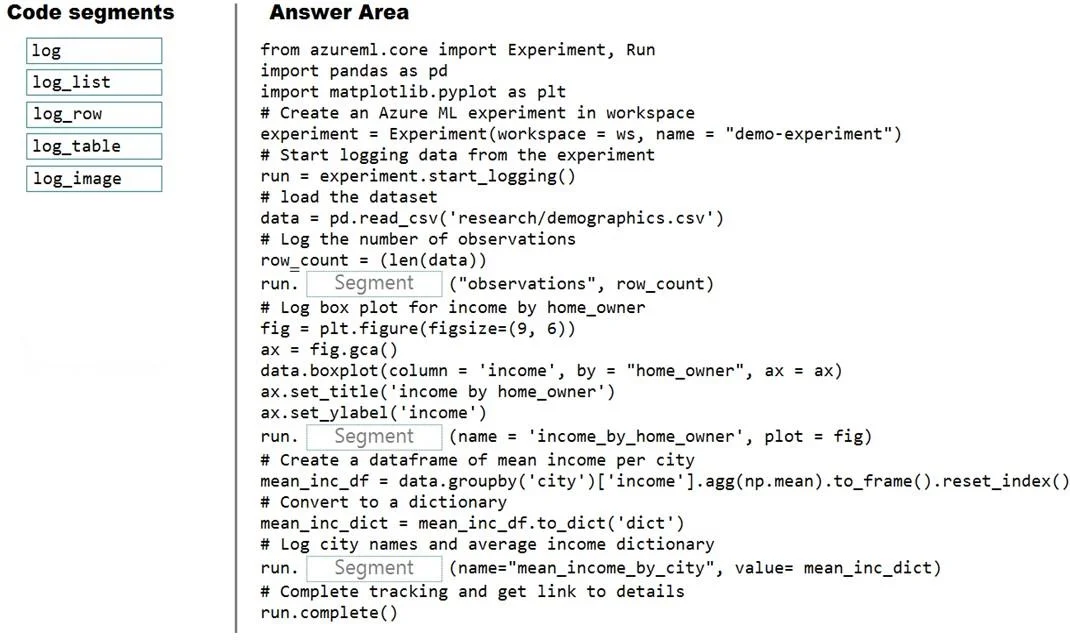
Drag and Drop Question You plan to explore demographic data for home ownership in various cities. The data is in a CSV file with the following format: age,city,income,home_owner 21,Chicago,50000,0…
The correct answer is log; log_image; log_table. The question tests the ability to correctly apply Azure ML Run object logging methods for different data types: scalar values, plots, and structured dictionaries.
Question
Exhibit
Answer Area
Drag items
Correct arrangement
- log
- log_image
- log_table
Explanation
The question tests the ability to correctly apply Azure ML Run object logging methods for different data types: scalar values, plots, and structured dictionaries.
Approach. The core task is to log three distinct types of information using the appropriate methods of the run object in Azure Machine Learning:
- Logging the number of observations (a single numerical value): The code calculates
row_count = len(data). To log a single key-value metric, therun.log()method is used. The blank for this requirement isrun. Segment ("observations", row_count). Therefore, 'log' should be dragged here. - Logging a box plot (a Matplotlib figure): The code generates a Matplotlib figure named
fig. To log an image or a plot, therun.log_image()method is specifically designed for this purpose. The blank for this requirement isrun. Segment (name = "income_by_home_owner", plot = fig). Therefore, 'log_image' should be dragged here. - Logging a dictionary of city names and average income: The code creates
mean_inc_dict, which is a dictionary mapping city names to average incomes. To log structured data like a dictionary or tabular data, therun.log_table()method is the most appropriate. It can interpret a dictionary as key-value pairs suitable for a table. The blank for this requirement isrun. Segment (name = "mean_income_by_city", value = mean_inc_dict). Therefore, 'log_table' should be dragged here.
Common mistakes.
- common_mistake. Common mistakes arise from misunderstanding the purpose of each logging method:
- Using 'log_list':
log_listis used to log a list of numeric values or strings under a single metric name. It's not suitable for a single scalar value, a plot, or a key-value dictionary that represents structured data. - Using 'log_row':
log_rowis used to log a single row of a table. While a dictionary could be interpreted as a row,log_tableis generally more versatile and idiomatic for logging a complete dictionary where keys often represent columns or distinct items. - Using 'log' for a plot or dictionary: The
logmethod is strictly for logging single key-value metrics (scalars). It cannot handle Matplotlib figure objects or complex dictionary structures directly for visualization or structured storage. - Interchanging 'log_table' with 'log_list' or 'log_row' for the dictionary: The
mean_inc_dictis structured data, andlog_tableis the most appropriate for representing such data in a structured, queryable format within the experiment run.
Concept tested. Azure Machine Learning experiment tracking and logging, specifically using the azureml.core.Run object's methods to log different data types (scalars, images/plots, and structured data like dictionaries) to track experiment metrics and artifacts.
Topics
Community Discussion
No community discussion yet for this question.