Databricks
DATABRICKS-CERTIFIED-PROFESSIONAL-DATA-SCIENTIST · Question #50
DATABRICKS-CERTIFIED-PROFESSIONAL-DATA-SCIENTIST Question #50: Real Exam Question with Answer & Explanation
Sign in or unlock DATABRICKS-CERTIFIED-PROFESSIONAL-DATA-SCIENTIST to reveal the answer and full explanation for question #50. The question stem and answer options stay visible for context.
Question
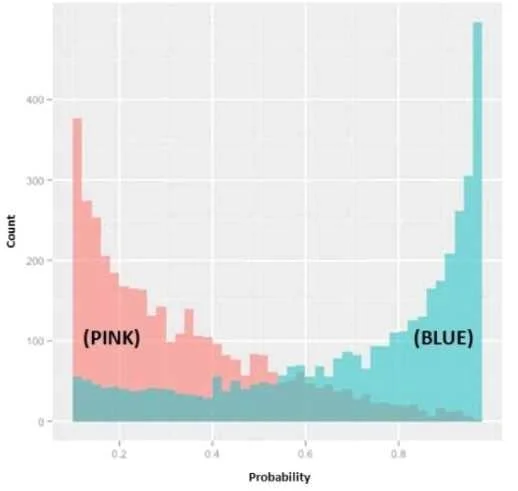
Refer to Exhibit In the exhibit, the x-axis represents the derived probability of a borrower defaulting on a loan. Also in the exhibit, the pink represents borrowers that are known to have not defaulted on their loan, and the blue represents borrowers that are known to have defaulted on their loan. Which analytical method could produce the probabilities needed to build this exhibit?
Exhibit
Options
- ALinear Regression
- BLogistic Regression
- CDiscriminant Analysis
- DAssociation Rules
Unlock DATABRICKS-CERTIFIED-PROFESSIONAL-DATA-SCIENTIST to see the answer
You've previewed enough free DATABRICKS-CERTIFIED-PROFESSIONAL-DATA-SCIENTIST questions. Unlock DATABRICKS-CERTIFIED-PROFESSIONAL-DATA-SCIENTIST for full answers, explanations, the timed quiz mode, progress tracking, and the master PDF. Question stem and options stay visible so you can still see what's on the exam.