
CSSGB · Question #146
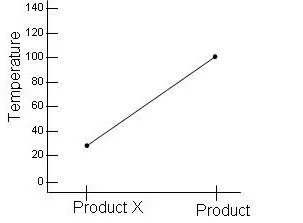
The following chart was developed by a six sigma team to measure reactions on two different products. In this chart, temperature represents the
The correct answer is C. response. In this Six Sigma Design of Experiments (DOE) context, temperature is the response - the measured output or dependent variable that results from testing the two products. Since the chart tracks the reactions of two products, temperature is what the team observed and recorded…
Question
The following chart was developed by a six sigma team to measure reactions on two different products. In this chart, temperature represents the
Exhibit
Options
- Arepetition
- Bfactor
- Cresponse
- Dlevel
How the community answered
(24 responses)- A13% (3)
- B4% (1)
- C79% (19)
- D4% (1)
Explanation
In this Six Sigma Design of Experiments (DOE) context, temperature is the response - the measured output or dependent variable that results from testing the two products. Since the chart tracks the reactions of two products, temperature is what the team observed and recorded, making it the response variable, not something they controlled.
Why the distractors are wrong:
- B (Factor): A factor is the independent variable that the team deliberately manipulates - here, the two different products being tested are the factors, not temperature.
- D (Level): Levels are the specific settings of a factor (e.g., Product A and Product B are the two levels of the "product" factor), not a separate variable.
- A (Repetition): Repetition refers to running the same experimental trial multiple times to improve reliability - it is not a variable on a chart.
Memory tip: In DOE, ask yourself "Is this variable controlled or measured?" - Factors are controlled (inputs), Responses are measured (outputs). Since temperature here reflects the reaction of the products, it is what was measured, making it the response.
Topics
Community Discussion
No community discussion yet for this question.