
AZ-400 · Question #60
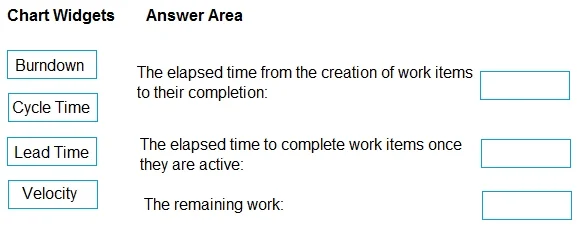
Drag and Drop Question You need to recommend project metrics for dashboards in Azure DevOps. Which chart widgets should you recommend for each metric? To answer, drag the appropriate chart widgets…
The correct answer is Lead Time; Cycle Time; Burndown. Lead Time measures the total time from when a work item is created to when it is completed, making it ideal for tracking end-to-end delivery time from a customer perspective. Cycle Time measures the time from when work actively begins on an item to its completion, reflecting…
Question
Exhibit
Answer Area
Drag items
Correct arrangement
- Lead Time
- Cycle Time
- Burndown
Explanation
Lead Time measures the total time from when a work item is created to when it is completed, making it ideal for tracking end-to-end delivery time from a customer perspective. Cycle Time measures the time from when work actively begins on an item to its completion, reflecting team efficiency and process speed. Burndown charts track remaining work over a sprint or release period, helping teams visualize progress toward completing planned work within a time boundary.
Topics
Community Discussion
No community discussion yet for this question.