
Adobe
AD0-E202 · Question #43
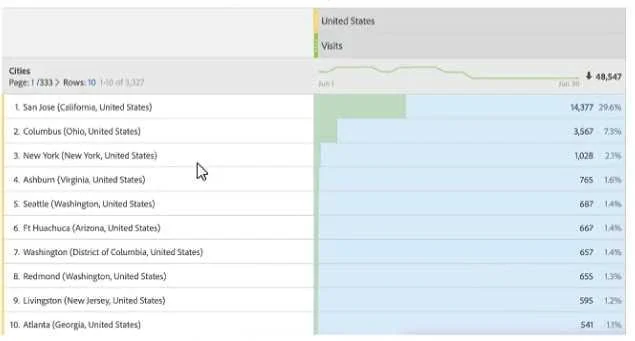
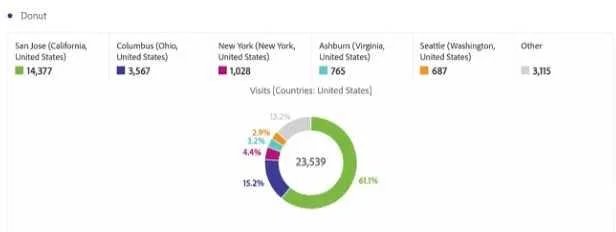
A client requests a donut chart of the top 10 cities. The analyst creates the following Freeform table. The following donut chart was already created, but only shows five cities and an `'Other''…
The correct answer is A. Open the visualization settings in the top right visualization menu, and set the item limit to 10. See the full explanation below for the reasoning.
Question
A client requests a donut chart of the top 10 cities. The analyst creates the following Freeform table. The following donut chart was already created, but only shows five cities and an `'Other'' bucket. What is the correct way to show all 10 cities in the same donut visualization?
Exhibits
Options
- AOpen the visualization settings in the top right visualization menu, and set the item limit to 10.
- BRight-click the visualization to set the item limit to 10.
- CChange the source freeform table to limit the amount of records.
- DClick on the `'Other'' bucket label to unhide the list of elements in this bucket.
How the community answered
(28 responses)- A75% (21)
- B14% (4)
- C7% (2)
- D4% (1)
Community Discussion
No community discussion yet for this question.