
70-779 · Question #37
Note: This question is part of a series of questions that present the same scenario. Each question in the series contains a unique solution that might meet the stated goals. Some question sets might…
Sign in or unlock 70-779 to reveal the answer and full explanation for question #37. The question stem and answer options stay visible for context.
Question
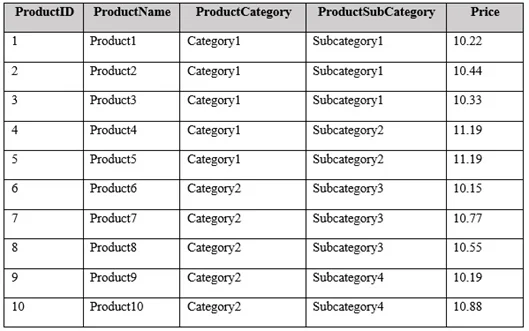
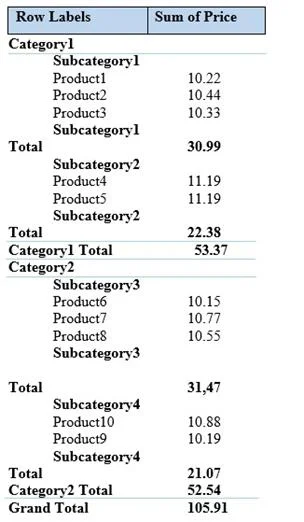
Note: This question is part of a series of questions that present the same scenario. Each question in the series contains a unique solution that might meet the stated goals. Some question sets might have more than one correct solution, while others might not have a correct solution. After you answer a question in this section, you will NOT be able to return to it. As a result, these questions will not appear in the review screen. You have an Excel workbook that contains a table named Table1. A sample of the data in Table1 is shown in the following table. You need to create a PivotTable in PowerPivot as shown in the exhibit. (Click the Exhibit button.) Solution: You create a measure named products the uses the DataTable DAX function. You add a PivotTable. You drag Products to the Rows field. You drag Price to the Values field. Does this meet the goal?
Exhibits
Options
- AYes
- BNo
Unlock 70-779 to see the answer
You've previewed enough free 70-779 questions. Unlock 70-779 for full answers, explanations, the timed quiz mode, progress tracking, and the master PDF. Question stem and options stay visible so you can still see what's on the exam.