
300-910 · Question #122
A developer created an application that stores all employee sensitive data. The application will be used by the HR department to store and run frequent reports based on the department needs. The HR…
The correct answer is A. Configure a DateTime filter to review metrics at approximately 4 PM each day. B. Analyze metrics for CPU Usage. To troubleshoot a server experiencing daily slowdowns at a specific time, it is essential to focus monitoring data on that exact time window and analyze resource utilization metrics like CPU usage.
Question
Exhibit
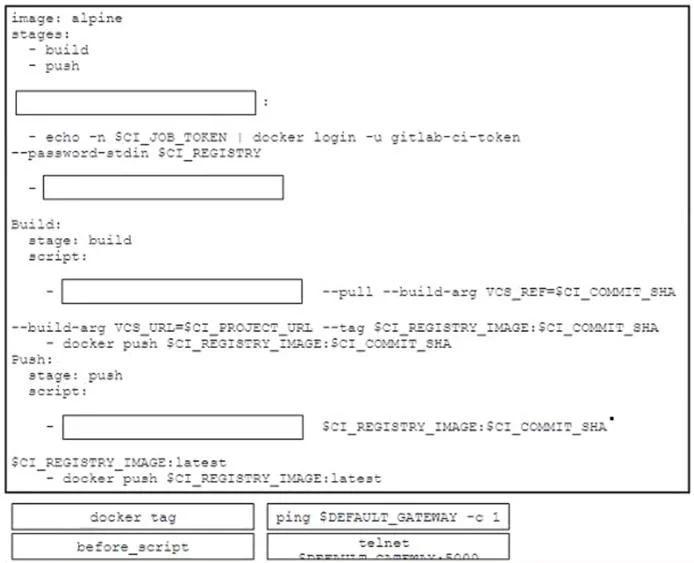
Options
- AConfigure a DateTime filter to review metrics at approximately 4 PM each day.
- BAnalyze metrics for CPU Usage.
- CAnalyze metrics for Customer Experience.
- DEnable live streaming to see metrics in real time.
- EFilter for servers in the data center.
How the community answered
(25 responses)- A72% (18)
- C4% (1)
- D8% (2)
- E16% (4)
Why each option
To troubleshoot a server experiencing daily slowdowns at a specific time, it is essential to focus monitoring data on that exact time window and analyze resource utilization metrics like CPU usage.
Configuring a DateTime filter allows the developer to narrow down the metric data to the specific time (around 4 PM) when the server experiences slowdowns, making it easier to identify recurring issues related to peak load or scheduled tasks.
Analyzing CPU Usage metrics directly indicates whether the server's processor is overloaded during the slowdown period, which is a common cause for applications running slowly. High CPU usage suggests the server is struggling to process requests or computations efficiently.
While customer experience is an outcome of performance, 'Customer Experience' is not a standard, directly measurable server metric for performance troubleshooting in the same way CPU usage is. Specific metrics like latency or error rates contribute to customer experience but aren't the primary troubleshooting metric itself.
Enabling live streaming provides real-time data but is less effective for investigating a recurring problem that happens at a specific time daily, as it requires active observation at that exact moment rather than retrospective analysis of historical data.
Filtering for servers in the data center is too broad and does not help isolate the problem to the specific server or time of the slowdown, as the issue is already known to be on a specific host and time.
Concept tested: Server performance troubleshooting and metric analysis.
Topics
Community Discussion
No community discussion yet for this question.