nerdexam
Broadcom-VMware

2V0-41.24 · Question #64

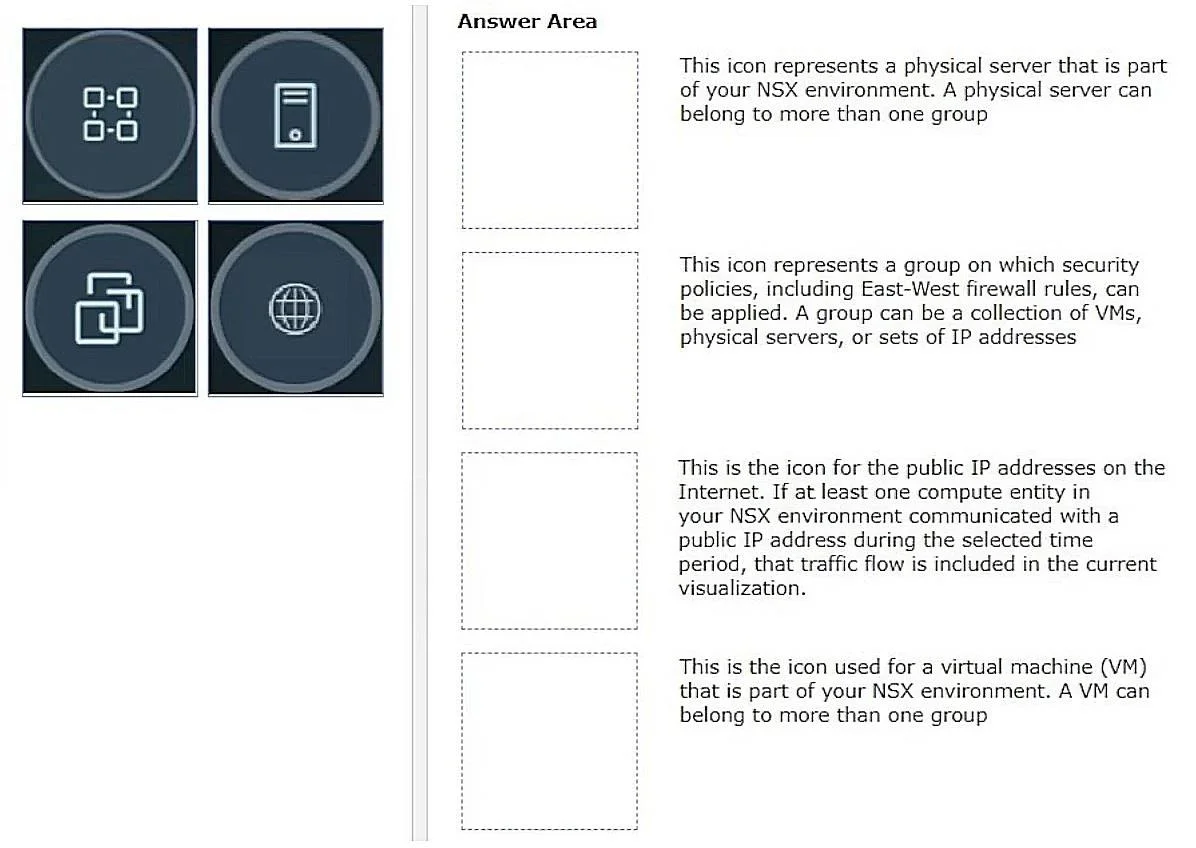
Drag and Drop Question Refer to the exhibits. Drag and drop the NSX graphic element icons on the left found in an NSX Intelligence visualization graph to Its correct description on the right. Answer:

The correct answer is Icon: Physical Server (monitor); Icon: Group (two squares side-by-side); Icon: Public IP Addresses (globe); Icon: VM (square with arrow pointing out). NSX Intelligence Visualization Graph Icons - Explained This question tests your ability to identify the four standard entity icons used in VMware NSX Intelligence's topology/visualization graph. NSX Intelligence renders network traffic between different types of workloads and…

Section 5 – NSX Troubleshooting and Operations

Question

Drag and Drop Question Refer to the exhibits. Drag and drop the NSX graphic element icons on the left found in an NSX Intelligence visualization graph to Its correct description on the right. Answer:

Exhibit
2V0-41.24 question #64 exhibit

Answer Area

Drag items

Icon: Group (two squares side-by-side)Icon: Physical Server (monitor)Icon: VM (square with arrow pointing out)Icon: Public IP Addresses (globe)

Correct arrangement

  • Icon: Physical Server (monitor)
  • Icon: Group (two squares side-by-side)
  • Icon: Public IP Addresses (globe)
  • Icon: VM (square with arrow pointing out)

Explanation

NSX Intelligence Visualization Graph Icons - Explained

This question tests your ability to identify the four standard entity icons used in VMware NSX Intelligence's topology/visualization graph. NSX Intelligence renders network traffic between different types of workloads and endpoints, each with a distinct icon.


The Correct Arrangement (matched to descriptions 1–4)

Position 1 → Physical Server (monitor icon)

The monitor icon represents bare-metal/physical servers connected to NSX-managed segments. These are non-virtualized hosts that participate in the NSX fabric. They're distinguished from VMs because they run directly on hardware without a hypervisor layer. A monitor icon visually conveys "real hardware," making it the natural choice for physical servers.

Common mistake: Confusing this with a VM. The key distinction is that physical servers appear as monitor icons, while VMs have a separate icon with an outbound arrow.


Position 2 → Group (two squares side-by-side)

The double-square icon represents an NSX Security Group or Policy Group - a logical collection of workloads (VMs, physical servers, etc.) sharing a common security policy. In the visualization graph, groups act as containers that cluster related entities together for policy application and traffic analysis.

Common mistake: Thinking this represents a network segment or VLAN. Groups are policy/membership constructs, not network topology constructs.


Position 3 → Public IP Addresses (globe icon)

The globe icon represents external/public IP addresses - destinations or sources outside the NSX-managed environment (i.e., internet-facing traffic). When workloads communicate with the public internet, those endpoints appear as globe icons in the traffic flow visualization.

Common mistake: Assuming this means "any external IP." It specifically means public/internet-facing IPs, not private IPs in a remote data center.


Position 4 → VM (square with arrow pointing out)

The square-with-outbound-arrow icon represents an individual virtual machine. VMs are the primary compute workloads in a vSphere/NSX environment and are the most common node type in the visualization. The arrow suggests a workload that can communicate outward.

Common mistake: Confusing this with the Physical Server icon. The arrow differentiates a VM (virtualized, mobile, can be migrated) from a physical server (static hardware).


Summary Table

PositionIconRepresents
1MonitorPhysical Server (bare metal)
2Two squaresGroup (Security/Policy Group)
3GlobePublic IP Addresses (internet)
4Square + arrowVirtual Machine (VM)

The ordering reflects the hierarchy NSX Intelligence uses: physical infrastructure → logical groupings → external endpoints → individual virtual workloads.

Topics

#NSX Intelligence#visualization graph#topology icons#traffic flow

Community Discussion

No community discussion yet for this question.

Full 2V0-41.24 Practice