
Oracle
1Z0-450 · Question #13
The Interactive Report is displayed in Exhibit 2 Which combination of three actions would need to take place to create the interactive report?
Sign in or unlock 1Z0-450 to reveal the answer and full explanation for question #13. The question stem and answer options stay visible for context.
Building Forms and Reports
Question
The Interactive Report is displayed in Exhibit 2 Which combination of three actions would need to take place to create the interactive report?
Exhibit
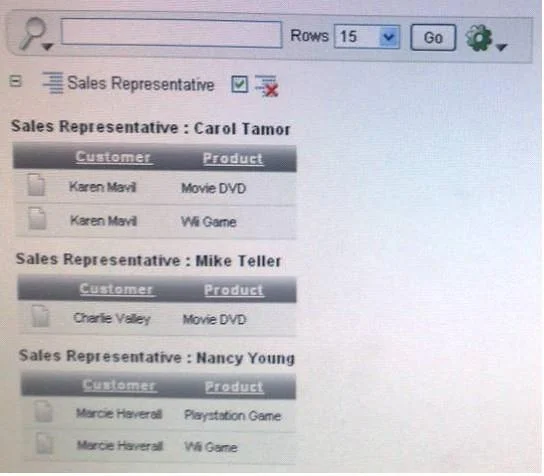
Options
- ACreate an Interactive Report region to show the list of EMPLOYEES and PRODUCTS based on the
- BCreate an Interactive Report region that contains a query between the CUSTOMERS, EMPLOYEES,
- CCreate an SQL Report region that contains a query between the CUSTOMERS, PRODUCTS and
- DCreate a filter on Customer FIRST_NAME and LAST_NAME.
- ECreate a Control Break on Sales Representative.
- FConcatenate FIRST_NAME and LAST NAME for both CUSTOMERS and EMPLOYEES in the query.
Unlock 1Z0-450 to see the answer
You've previewed enough free 1Z0-450 questions. Unlock 1Z0-450 for full answers, explanations, the timed quiz mode, progress tracking, and the master PDF. Question stem and options stay visible so you can still see what's on the exam.
Topics
#interactive report#table joins#control break#column concatenation