
Palo_Alto_Networks
XSOAR-ENGINEER · Question #16
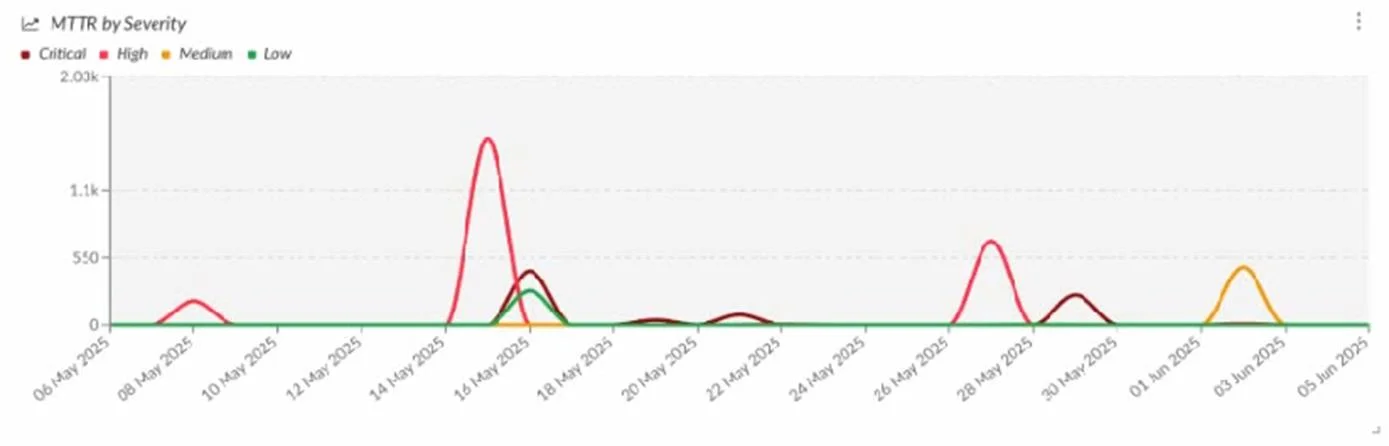
An organization defines Mean Time To Resolve (MTTR) as the mean time duration that an incident was open. Which widget options will generate a line graph widget showing the MTTR by incident severity…
Sign in or unlock XSOAR-ENGINEER to reveal the answer and full explanation for question #16. The question stem and answer options stay visible for context.
Dashboards and Reporting
Question
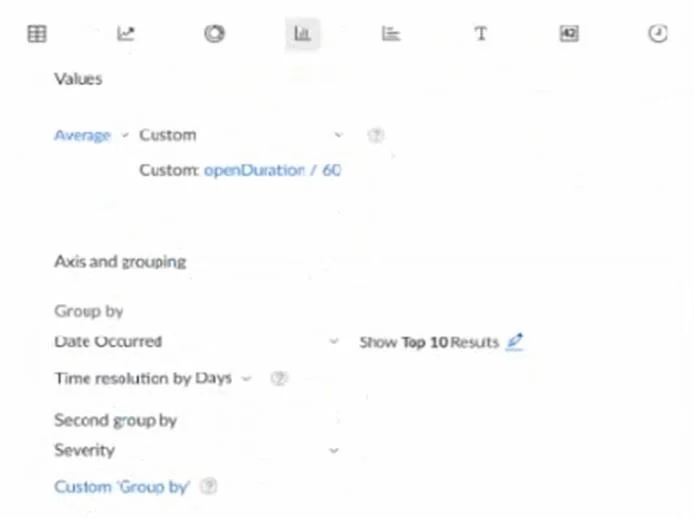
An organization defines Mean Time To Resolve (MTTR) as the mean time duration that an incident was open. Which widget options will generate a line graph widget showing the MTTR by incident severity like the image below? A. B. C. D.
Exhibits
Options
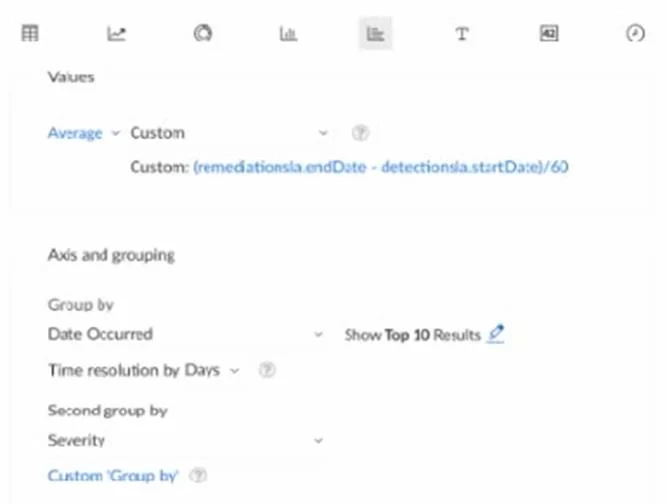
- AValues: Average - Custom ((remediationsla.endDate - detectionsla.startDate)/60). Axis and grouping: Group by Date Occurred, Time resolution by Days, Second group by Severity, Show Top 10 Results.
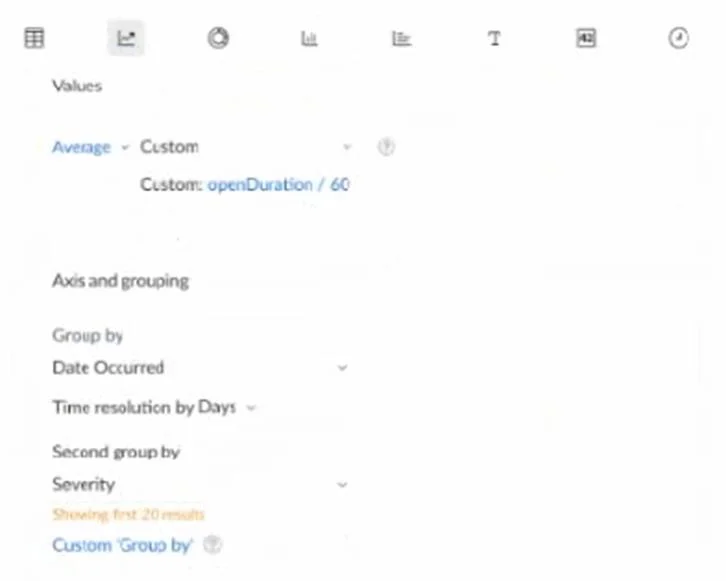
- BValues: Average - Custom (openDuration / 60). Axis and grouping: Group by Date Occurred, Time resolution by Days, Second group by Severity, Showing first 20 results.
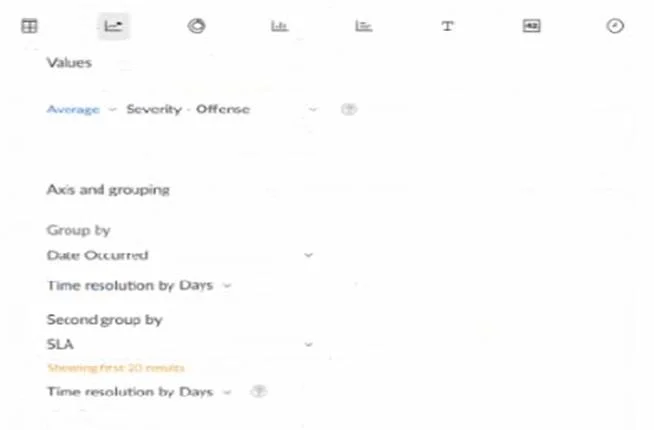
- CValues: Average - Severity - Offense. Axis and grouping: Group by Date Occurred, Time resolution by Days, Second group by SLA.
- DValues: Average - Custom (openDuration / 60). Axis and grouping: Group by Date Occurred, Time resolution by Days, Second group by Severity, Show Top 10 Results: enabled.
Unlock XSOAR-ENGINEER to see the answer
You've previewed enough free XSOAR-ENGINEER questions. Unlock XSOAR-ENGINEER for full answers, explanations, the timed quiz mode, progress tracking, and the master PDF. Question stem and options stay visible so you can still see what's on the exam.
Topics
#MTTR#dashboard widgets#line graph#incident metrics