
Broadcom-VMware
VCP510 · Question #74
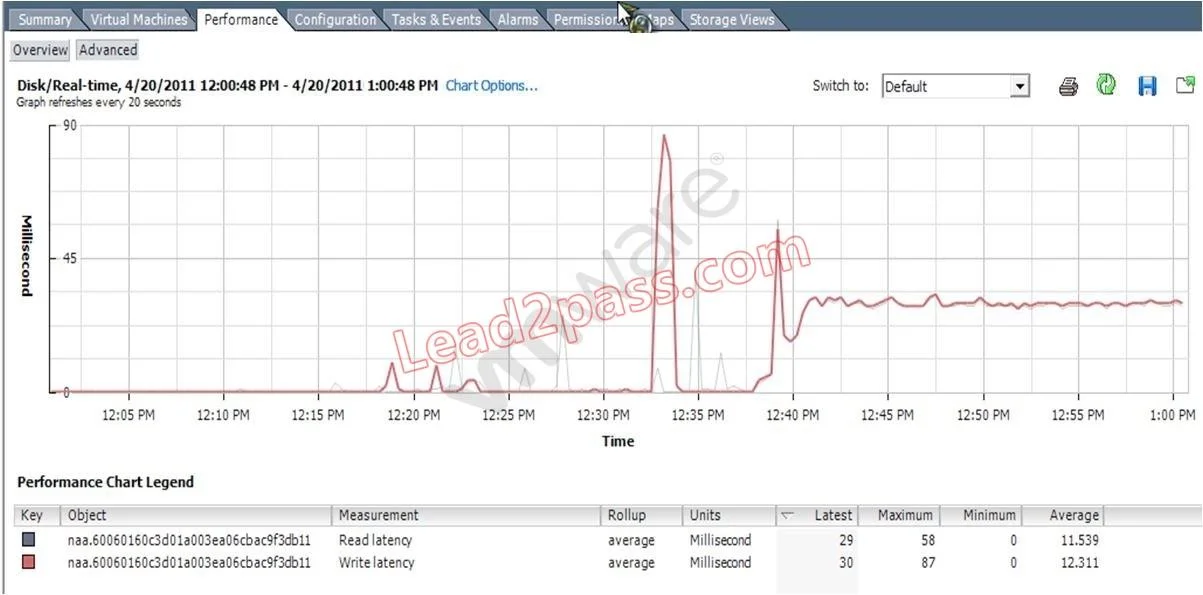
Click the Exhibit button. What does the graph in the exhibit indicate?
The correct answer is C. The average amount of read and write latency from the ESXi host to the datastore. See the full explanation below for the reasoning.
Question
Click the Exhibit button. What does the graph in the exhibit indicate?
Exhibit
Options
- AThe average amount of read and write latency from the ESXi host to the SAN.
- BThe average amount of read and write latency from the guest operating system to the virtual machine
- CThe average amount of read and write latency from the ESXi host to the datastore.
- DThe average amount of read and write latency from the cluster to the datastore.
How the community answered
(48 responses)- A6% (3)
- B13% (6)
- C77% (37)
- D4% (2)
Community Discussion
No community discussion yet for this question.