
Broadcom-VMware
VCP5-DCV · Question #74
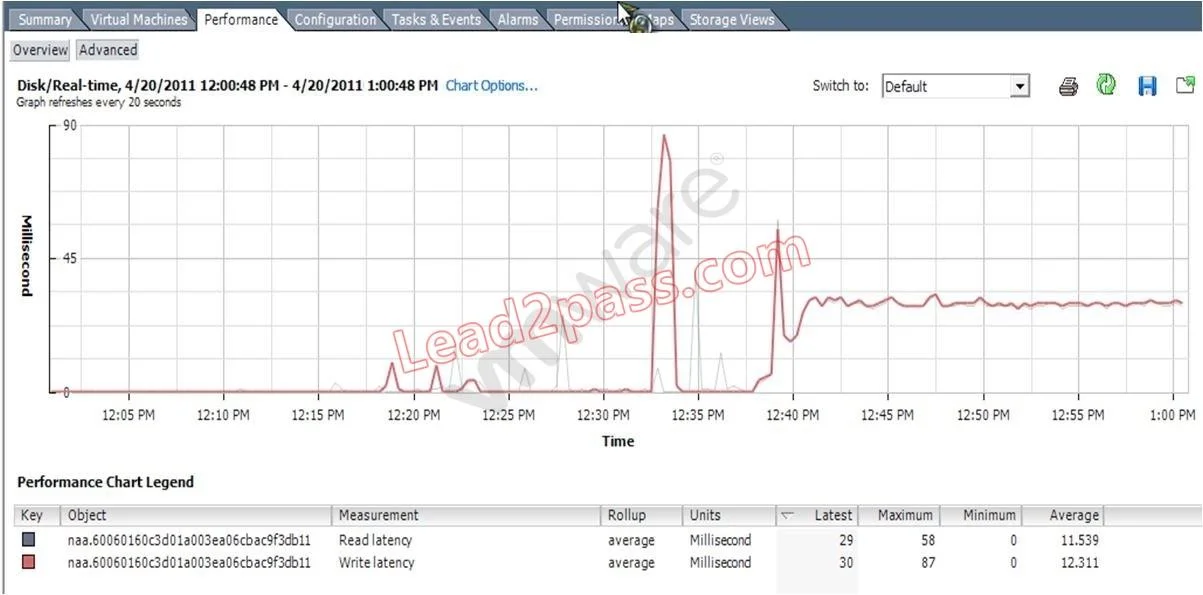
Click the Exhibit button. What does the graph in the exhibit indicate?
Sign in or unlock VCP5-DCV to reveal the answer and full explanation for question #74. The question stem and answer options stay visible for context.
Question
Click the Exhibit button. What does the graph in the exhibit indicate?
Exhibit
Options
- AThe average amount of read and write latency from the ESXi host to the SAN.
- BThe average amount of read and write latency from the guest operating system to the virtual machine
- CThe average amount of read and write latency from the ESXi host to the datastore.
- DThe average amount of read and write latency from the cluster to the datastore.
Unlock VCP5-DCV to see the answer
You've previewed enough free VCP5-DCV questions. Unlock VCP5-DCV for full answers, explanations, the timed quiz mode, progress tracking, and the master PDF. Question stem and options stay visible so you can still see what's on the exam.