
TDS-C01 · Question #39
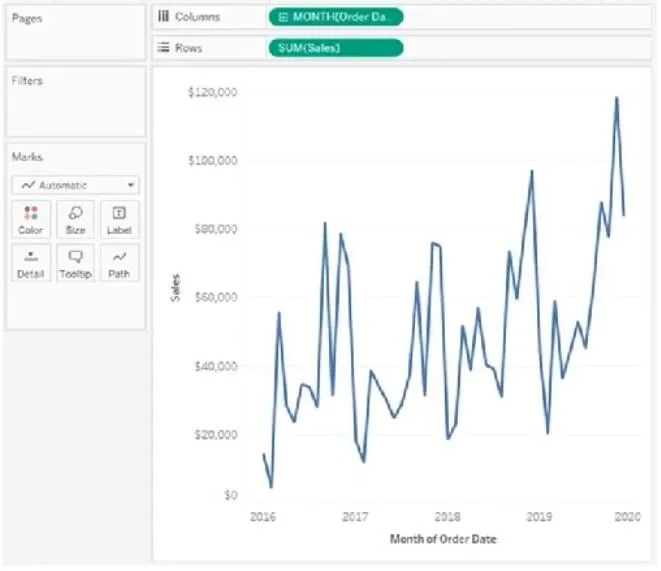
You have the following visualization. Where should you place a field named Region to show multiple distinct lines on the same axis?
The correct answer is B. Color on the Marks card. To display multiple distinct lines on the same axis in Tableau, you should drag the Region field to the Color option on the Marks card. This will create separate lines for each region, each with a different color, allowing you to see multiple lines on the same axis and easily…
Question
You have the following visualization. Where should you place a field named Region to show multiple distinct lines on the same axis?
Exhibit
Options
- AThe Rows shelf
- BColor on the Marks card
- CPath on the Marks card
- DThe Columns shelf
How the community answered
(37 responses)- A3% (1)
- B92% (34)
- D5% (2)
Explanation
To display multiple distinct lines on the same axis in Tableau, you should drag the Region field to the Color option on the Marks card. This will create separate lines for each region, each with a different color, allowing you to see multiple lines on the same axis and easily distinguish them. Placing Region on Rows or Columns would change the layout, and using Path is typically for line ordering within a single line rather than creating distinct lines.
Topics
Community Discussion
No community discussion yet for this question.