
TDS-C01 · Question #17
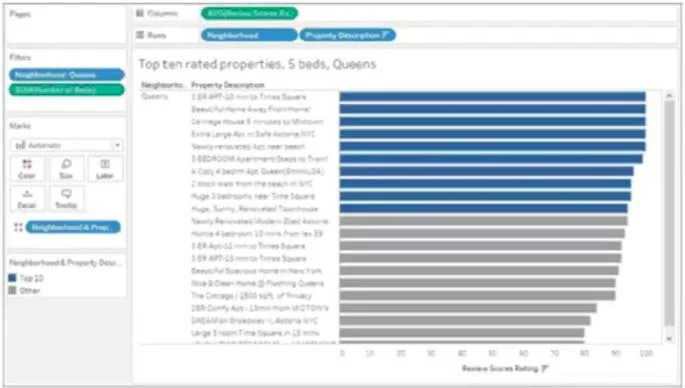
You create the following visualization. What is the first step to create the visual grouping of the 10 marks shown in blue?
The correct answer is A. Select the desired 10 marks in the view. To create a visual grouping of the top 10 marks shown in blue, the first step is to select the desired 10 marks directly in the view. Once selected, you can then use options such as creating a group or set from the selected marks to differentiate them visually in the chart…
Question
You create the following visualization. What is the first step to create the visual grouping of the 10 marks shown in blue?
Exhibit
Options
- ASelect the desired 10 marks in the view
- BSelect the desired 10 text labels under Property Description
- CCreate a Group on the Property Description field in the Data pane
- DCreate a Set on the Neighborhood field in the Data pane
How the community answered
(46 responses)- A70% (32)
- B9% (4)
- C4% (2)
- D17% (8)
Explanation
To create a visual grouping of the top 10 marks shown in blue, the first step is to select the desired 10 marks directly in the view. Once selected, you can then use options such as creating a group or set from the selected marks to differentiate them visually in the chart. This selection method provides an efficient way to highlight or isolate specific data points based on the view
Topics
Community Discussion
No community discussion yet for this question.