
PROFESSIONAL-DATA-ENGINEER · Question #146
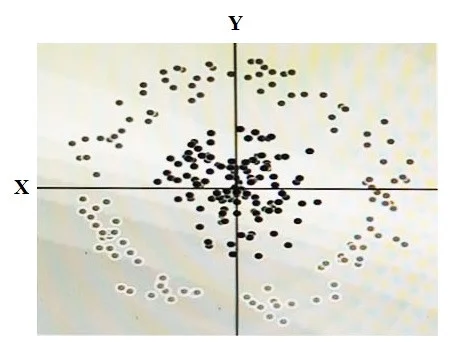
You have some data, which is shown in the graphic below. The two dimensions are X and Y, and the shade of each dot represents what class it is. You want to classify this data accurately using a…
The correct answer is A. X^2+Y^2. Adding X²+Y² as a synthetic feature computes the squared Euclidean distance from the origin, which transforms circularly-distributed data (one class forming a ring around another) into data that is linearly separable - a simple threshold on this new feature cleanly divides the…
Question
Exhibit
Options
- AX^2+Y^2
- BX^2
- CY^2
- Dcos(X)
How the community answered
(43 responses)- A79% (34)
- B5% (2)
- C14% (6)
- D2% (1)
Explanation
Adding X²+Y² as a synthetic feature computes the squared Euclidean distance from the origin, which transforms circularly-distributed data (one class forming a ring around another) into data that is linearly separable - a simple threshold on this new feature cleanly divides the classes. Options B (X²) and C (Y²) each capture only one axis of radial distance, so they fail for points that are symmetric across the Y-axis or X-axis respectively, leaving the classes still mixed along the ignored dimension. Option D (cos(X)) applies a periodic transformation that has no relationship to the circular boundary separating the classes and does not reduce the distance-from-origin structure the data exhibits. Memory tip: When you see dots arranged in concentric rings or circles in 2D, think "radius squared" - X²+Y² is the squared distance formula, and adding it "unfolds" the circle into a straight line a linear classifier can draw.
Topics
Community Discussion
No community discussion yet for this question.