
OGBA-101 · Question #4
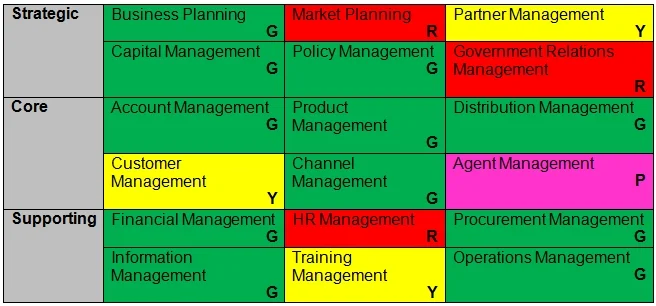
Consider the following business capability map, where cells of a model are given different colors to represent maturity levels (note the letters G, R, Y, P also denote the colors used = Green, Red…
The correct answer is A. Heat Mapping. The technique shown in the example is called heat mapping. It is a technique that can be used to show a range of different perspectives on a business capability map, such as maturity, effectiveness, performance, and value or cost contribution of each capability to the business…
Question
Consider the following business capability map, where cells of a model are given different colors to represent maturity levels (note the letters G, R, Y, P also denote the colors used = Green, Red, Yellow and Purple):
Which of the following best describes this technique?
Exhibit
Options
- AHeat Mapping
- BPerspective Analysis
- CGap Analysis
- DCapability Mapping
How the community answered
(66 responses)- A74% (49)
- B3% (2)
- C8% (5)
- D15% (10)
Explanation
The technique shown in the example is called heat mapping. It is a technique that can be used to show a range of different perspectives on a business capability map, such as maturity, effectiveness, performance, and value or cost contribution of each capability to the business. Different attributes determine the colors of each capability on the business capability map. Heat mapping can help to identify strengths, weaknesses, opportunities, and threats in the business
Topics
Community Discussion
No community discussion yet for this question.