
NSE5_FAZ-7.2 · Question #145
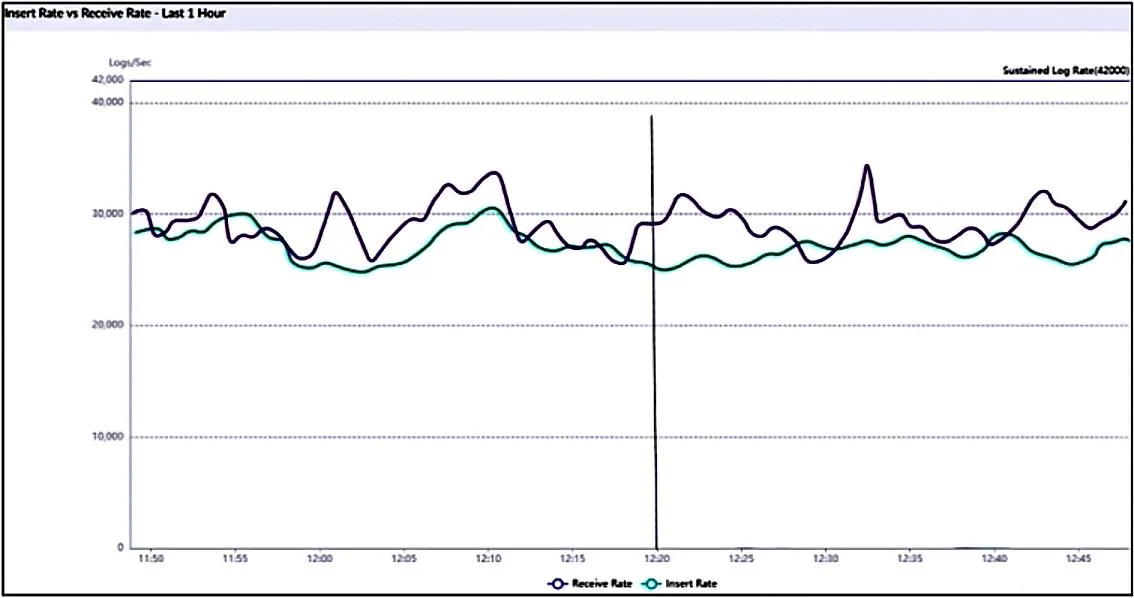
Refer to the exhibit. What does the data point at 12:20 indicate?
The correct answer is C. The log insert lag time is increasing. Insert Rate vs. Receive Rate is a graph that shows the rate at which raw logs reach the FortiAnalyzer (receive rate) and the rate at which they are indexed (insert rate) by the SQL database and the sqlplugind daemon. At minimum, the difference between these parameters should be…
Question
Refer to the exhibit. What does the data point at 12:20 indicate?
Exhibit
Options
- AThe performance of FortiAnalyzer is below the baseline.
- BFortiAnalyzer is using its cache to avoid dropping logs.
- CThe log insert lag time is increasing.
- DThe sqlplugind service is caught up with new logs.
How the community answered
(62 responses)- A5% (3)
- B13% (8)
- C79% (49)
- D3% (2)
Explanation
Insert Rate vs. Receive Rate is a graph that shows the rate at which raw logs reach the FortiAnalyzer (receive rate) and the rate at which they are indexed (insert rate) by the SQL database and the sqlplugind daemon. At minimum, the difference between these parameters should be generally consistent. Log Insert Lag Time shows the amount of time between when a log was received and when it was indexed. Ideally, this parameter should be as small as possible with the occasional spikes according to the network activity being logged. A good baseline should be created to allow for the identification of possible performance issues.
Topics
Community Discussion
No community discussion yet for this question.