
MLS-C01 · Question #251
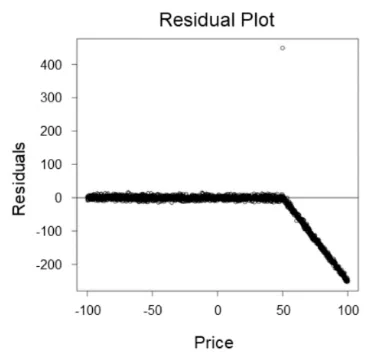
A retail company wants to create a system that can predict sales based on the price of an item. A machine learning (ML) engineer built an initial linear model that resulted in the following residual…
The correct answer is B. Create two different models for different sections of the data. E. Examine the input data, and apply non-linear data transformations where appropriate. F. Use a non-linear model instead of a linear model. To improve the accuracy of a linear model whose residual plot shows a non-random pattern, the ML engineer should address the underlying non-linearity by considering multiple models for different data sections, applying non-linear data transformations, or using a non-linear…
Question
A retail company wants to create a system that can predict sales based on the price of an item. A machine learning (ML) engineer built an initial linear model that resulted in the following residual plot:
Which actions should the ML engineer take to improve the accuracy of the predictions in the next phase of model building? (Choose three.)
Exhibit
Options
- ADownsample the data uniformly to reduce the amount of data.
- BCreate two different models for different sections of the data.
- CDownsample the data in sections where Price < 50.
- DOffset the input data by a constant value where Price > 50.
- EExamine the input data, and apply non-linear data transformations where appropriate.
- FUse a non-linear model instead of a linear model.
How the community answered
(16 responses)- A6% (1)
- B69% (11)
- C19% (3)
- D6% (1)
Why each option
To improve the accuracy of a linear model whose residual plot shows a non-random pattern, the ML engineer should address the underlying non-linearity by considering multiple models for different data sections, applying non-linear data transformations, or using a non-linear model entirely.
Downsampling data uniformly reduces the available information for training and is unlikely to address issues like non-linearity or heteroscedasticity visible in a residual plot.
If the residual plot shows different patterns in distinct sections of the data, creating separate models for these sections can capture the varying relationships more accurately than a single global model.
Downsampling data only in specific sections reduces valuable information for those areas and does not inherently resolve the model's inability to capture the correct relationship.
Offsetting input data by a constant value is a linear transformation and will not resolve non-linear patterns or heteroscedasticity evident in the residual plot.
A non-random pattern in residuals strongly indicates that the linear model is not capturing the true relationship, and applying non-linear transformations (e.g., log, polynomial features) to input data can help the linear model better fit such patterns.
The presence of a non-random pattern in the residual plot is a strong signal that the relationship is non-linear, and replacing the linear model with a more flexible non-linear model (e.g., polynomial regression, decision tree) can significantly improve accuracy.
Concept tested: Residual analysis, improving model fit, non-linear modeling
Source: https://scikit-learn.org/stable/modules/linear_model.html
Topics
Community Discussion
No community discussion yet for this question.