
MB-700 · Question #203
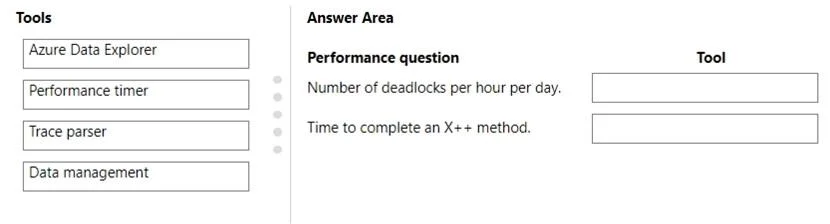
Drag and Drop Question A company uses Dynamics 365 finance and operations apps. The company creates its performance monitoring strategy. The implementation has complex modifications and data…
This question tests knowledge of the appropriate Dynamics 365 F&O performance monitoring tools for different types of performance issues: deadlocks, complex code modifications, and data-intensive processes.
Question
Exhibit
Explanation
This question tests knowledge of the appropriate Dynamics 365 F&O performance monitoring tools for different types of performance issues: deadlocks, complex code modifications, and data-intensive processes.
Approach. SQL Server Profiler is the correct tool for identifying deadlocks because it captures low-level SQL Server events, including lock escalations and deadlock graphs, which are database-engine-level events invisible to the application layer. Trace Parser is the correct tool for both complex modifications and data-intensive processes because it analyzes X++ execution traces captured by the Dynamics 365 tracing framework - it breaks down time spent per method, SQL calls, and RPC calls, making it ideal for profiling custom code and heavy data operations at the application layer.
Concept tested. Dynamics 365 F&O performance monitoring tool selection: SQL Server Profiler for database-level issues (deadlocks, locking), Trace Parser for application-level issues (X++ code performance, data-intensive operations).
Reference. Microsoft Learn: Performance troubleshooting using tools in Finance and Operations - https://learn.microsoft.com/en-us/dynamics365/fin-ops-core/dev-itpro/perf-test/performance-troubleshooting
Topics
Community Discussion
No community discussion yet for this question.