
FCP_FWB_AD-7.4 · Question #19
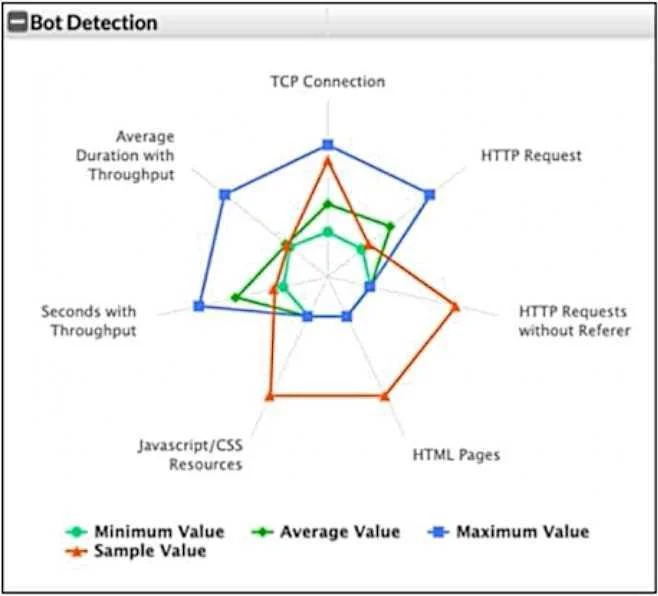
Refer to the exhibit. What can you conclude from this support vector machine (SVM) plot of a potential bot connection?
The correct answer is D. The connection is possibly a bot. In the SVM plot of potential bot activity, you can see that the sample value (orange) is significantly different from the average value (green) and the maximum value (blue) in most of the metrics. This suggests unusual or abnormal behavior, indicating that the connection might…
Question
Refer to the exhibit. What can you conclude from this support vector machine (SVM) plot of a potential bot connection?
Exhibit
Options
- AThe connection is normal and within the expected averages.
- BThe connection uses too much bandwidth.
- CThe connection uses an excessive amount of TCP connections, but is harmless.
- DThe connection is possibly a bot.
How the community answered
(41 responses)- A7% (3)
- B12% (5)
- C2% (1)
- D78% (32)
Explanation
In the SVM plot of potential bot activity, you can see that the sample value (orange) is significantly different from the average value (green) and the maximum value (blue) in most of the metrics. This suggests unusual or abnormal behavior, indicating that the connection might be a bot. Typically, bots exhibit patterns that diverge from normal user activity, such as higher frequencies of certain types of requests, abnormal throughput, or an unusual pattern of HTTP requests (such as requests without referers or excessive TCP connections).
Topics
Community Discussion
No community discussion yet for this question.