
FCP_FAZ_AN-7.4 · Question #21
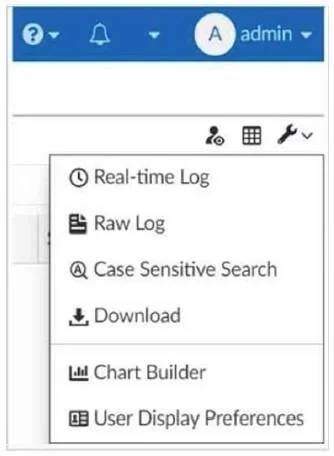
Refer to the exhibit. What is the purpose of using the Chart Builder feature on FortiAnalyzer?
The correct answer is D. To build a dataset and chart based on the filtered search results. A quick way to build a custom dataset and chart is to use the chart builder tool. This tool is located in LogView, and allows you to build a dataset and chart automatically, based on your filtered search results. In LogView, set filters to return the logs you want.
Question
Refer to the exhibit. What is the purpose of using the Chart Builder feature on FortiAnalyzer?
Exhibit
Options
- ATo build a chart automatically based on the top 100 log entries
- BTo add charts directly to generate reports in the current ADOM.
- CTo add a new chart under FortiView to be used in new reports
- DTo build a dataset and chart based on the filtered search results
How the community answered
(18 responses)- A6% (1)
- B6% (1)
- C11% (2)
- D78% (14)
Explanation
A quick way to build a custom dataset and chart is to use the chart builder tool. This tool is located in LogView, and allows you to build a dataset and chart automatically, based on your filtered search results. In LogView, set filters to return the logs you want.
Topics
Community Discussion
No community discussion yet for this question.