
Dell-EMC
E20-495 · Question #118
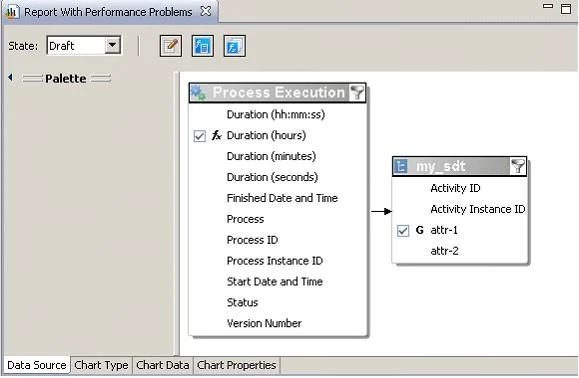
Refer to the exhibit. The report definition shown in the exhibit is for a bar chart that displays the average Duration of Process Execution for a specific process, aggregated by attr1 of my_sdt. The…
The correct answer is D. Create an index on the attr1 column of the table that represents the my_sdt entity in the BAM. See the full explanation below for the reasoning.
Question
Refer to the exhibit. The report definition shown in the exhibit is for a bar chart that displays the average Duration of Process Execution for a specific process, aggregated by attr1 of my_sdt. The report has not been tuned for performance. What can an application developer do to improve performance of this report?
Exhibit
Options
- ARemove the filter from the Process Execution entity and re-publish the report.
- BRemove the filter from the my_sdt entity and re-publish the report.
- CCreate an index on the Duration column of the table that represents the Process Execution entity
- DCreate an index on the attr1 column of the table that represents the my_sdt entity in the BAM
How the community answered
(37 responses)- A5% (2)
- B3% (1)
- C8% (3)
- D84% (31)
Community Discussion
No community discussion yet for this question.