
Dell-EMC
E20-007 · Question #162
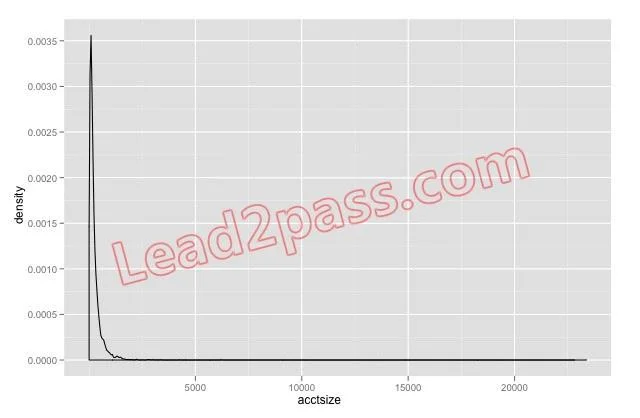
Refer to the exhibit. You have plotted the distribution of savings account sizes for your bank. How would you proceed, based on this distribution?
Sign in or unlock E20-007 to reveal the answer and full explanation for question #162. The question stem and answer options stay visible for context.
Question
Refer to the exhibit. You have plotted the distribution of savings account sizes for your bank. How would you proceed, based on this distribution?
Exhibit
Options
- AThe data is extremely skewed,but looks bimodal; replot the data in the range 2,500-10,000 to be sure.
- BThe data is extremely skewed. Replot the data on a logarithmic scale to get a better sense of it.
- CThe accounts of size greater than 2500 are rare,and probably outliers. Eliminate them from your
- DThe data is extremely skewed. Split your analysis into two cohorts: accounts less than 2500,and
Unlock E20-007 to see the answer
You've previewed enough free E20-007 questions. Unlock E20-007 for full answers, explanations, the timed quiz mode, progress tracking, and the master PDF. Question stem and options stay visible so you can still see what's on the exam.