Microsoft
DP-900 · Question #142
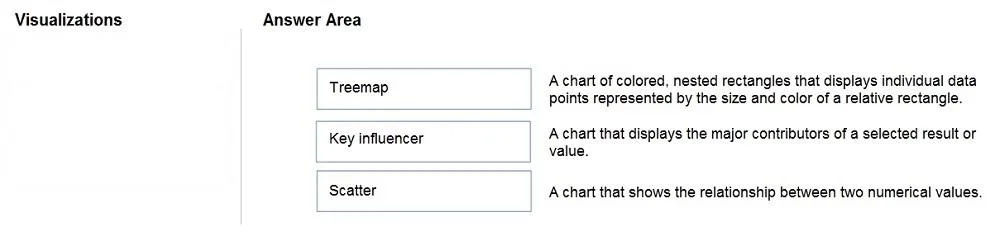
Drag and Drop Question Match the types of visualizations to the appropriate descriptions. To answer, drag the appropriate visualization type from the column on the left to its description on the right
Sign in or unlock DP-900 to reveal the answer and full explanation for question #142. The question stem and answer options stay visible for context.
Submitted by jakub_pl· Mar 30, 2026Design and Build Power BI Reports and Dashboards - selecting appropriate visualization types based on data characteristics and analytical goals (PL-300 / DA-100 certification)
Question
Drag and Drop Question Match the types of visualizations to the appropriate descriptions. To answer, drag the appropriate visualization type from the column on the left to its description on the right. Each visualization type may be used once, more than once, or not at all. NOTE: Each correct match is worth one point. Answer:
Exhibit
Answer Area
Drag items
Key influencerScatterTreemap
Unlock DP-900 to see the answer
You've previewed enough free DP-900 questions. Unlock DP-900 for full answers, explanations, the timed quiz mode, progress tracking, and the master PDF. Question stem and options stay visible so you can still see what's on the exam.
Topics
#Power BI Visualizations#Data Analytics#Chart Types#Visual Selection