
DP-600 · Question #85
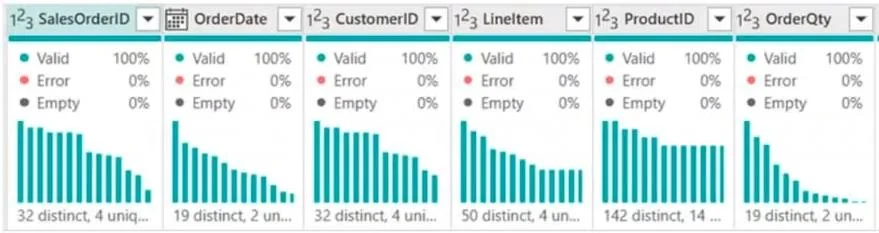
You have a Microsoft Fabric tenant that contains a dataflow. You are exploring a new semantic model. From Power Query, you need to view column information as shown in the following exhibit. Which…
The correct answer is A. Show column value distribution C. Enable column profile D. Show column quality details. Show column value distribution: This option provides a visual representation of the distribution of values in each column, which is visible in the exhibit. Enable column profile: This option displays statistics and other detailed information about each column, including value…
Question
You have a Microsoft Fabric tenant that contains a dataflow. You are exploring a new semantic model. From Power Query, you need to view column information as shown in the following exhibit. Which three Data view options should you select? Each correct answer presents part of the solution.
Exhibit
Options
- AShow column value distribution
- BEnable details pane
- CEnable column profile
- DShow column quality details
- EShow column profile in details pane
How the community answered
(24 responses)- A92% (22)
- B4% (1)
- E4% (1)
Explanation
Show column value distribution: This option provides a visual representation of the distribution of values in each column, which is visible in the exhibit. Enable column profile: This option displays statistics and other detailed information about each column, including value distribution, which aligns with the data shown in the exhibit. Show column quality details: This option shows the quality of the data in each column, indicating valid, error, and empty values, as displayed in the exhibit.
Topics
Community Discussion
No community discussion yet for this question.