
Microsoft
DP-500 · Question #140
You have an Azure Synapse Analytics workspace that contains an Apache Spark pool. You create a notebook and configure a cell that runs the following SparkSQL query. SELECT ProductID, ProductName…
Key: Category, Values: ProductID, Aggregation: Count
Explore and visualize data
Question
You have an Azure Synapse Analytics workspace that contains an Apache Spark pool. You create a notebook and configure a cell that runs the following SparkSQL query.
SELECT ProductID, ProductName, Category
From products
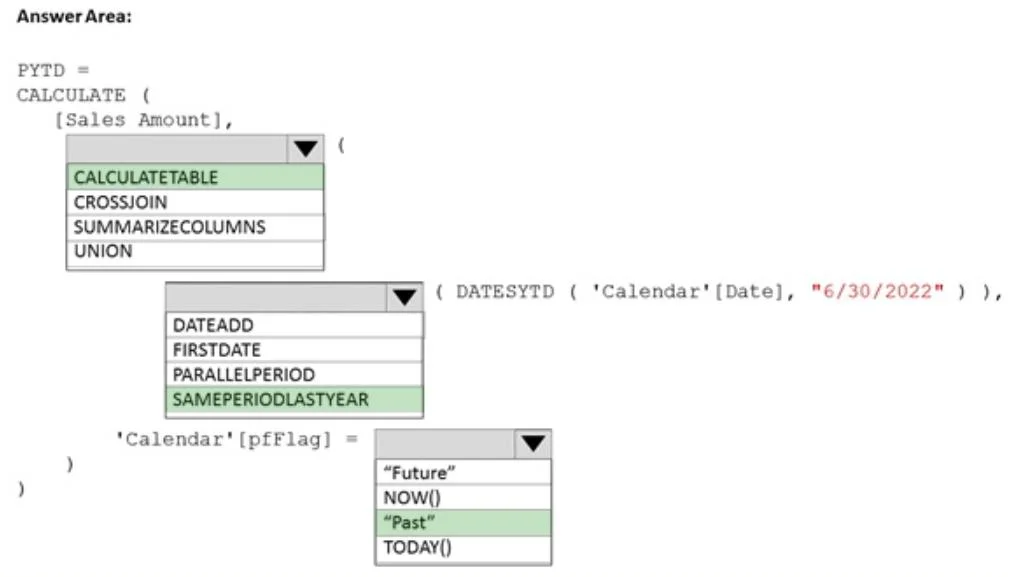
You need to create a column chart by using the built-in charting capability. The solution must visualize the distribution of product IDs across product categories. How should you complete the column chart? To answer, select the appropriate options in the answer area. NOTE: Each correct selection is worth one point.
Exhibit
Explanation
Key: Category, Values: ProductID, Aggregation: Count
Topics
#Data Visualization#Column Charts#Azure Synapse Analytics#Spark Notebooks
Community Discussion
No community discussion yet for this question.