
DP-500 · Question #112
You work for a company which sells mobile phones. The company has an Azure Synapse Analytics dataset that contains data related to the sales of this year's latest mobile phone. You plan to use…
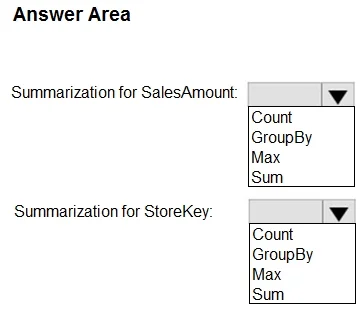
The question requires selecting the correct aggregation functions for sales amount and store key to prepare data for a bar graph visualization using Apache Spark notebooks.
Question
Exhibit
Explanation
The question requires selecting the correct aggregation functions for sales amount and store key to prepare data for a bar graph visualization using Apache Spark notebooks.
Approach. To visualize sales-related data in a bar graph, we typically want to see the total sales for different categories. In this scenario, 'SalesAmount' represents the value of each sale, and 'StoreKey' represents the identifier for each store. Therefore, to get the total sales amount, we need to 'Sum' the 'SalesAmount' column. To visualize these sums 'by store', we must 'GroupBy' the 'StoreKey' column. This combination - GroupBy StoreKey and then Sum SalesAmount - allows for a bar graph showing total sales per store. Hence, 'Sum' is selected for 'SalesAmount' and 'GroupBy' is selected for 'StoreKey'.
Common mistakes.
- common_mistake. Using 'Count' for 'SalesAmount' would only tell us the number of sales transactions, not the total revenue generated, which is usually the intent when visualizing 'sales-related data' for a bar graph. 'Max' for 'SalesAmount' would only show the highest single sale, not the overall sales performance. For 'StoreKey', selecting 'Count', 'Max', or 'Sum' directly is incorrect because 'StoreKey' is an identifier used for categorizing, not for direct aggregation of its values. 'Count' on 'StoreKey' without 'GroupBy' would give the total number of entries, not sales per store. 'Max' or 'Sum' on 'StoreKey' would result in a meaningless numerical value, as 'StoreKey' is meant to define groups for aggregation, not be aggregated itself in this context.
Concept tested. Data aggregation and grouping operations, specifically using Spark DataFrame API concepts like groupBy() and aggregate functions such as sum(), count(), and max(), for data preparation and visualization.
Topics
Community Discussion
No community discussion yet for this question.