
DP-203 · Question #381
Drag and Drop Question You have an Azure Data Lake Storage account named account1. You use an Azure Synapse Analytics serverless SQL pool to access sales data stored in account1. You need to create…
The correct answer is Create a SQL script by using Synapse Studio.; Add a SELECT statement that will return the sales by product data.; Execute the script.; Switch to the Chart view.; Modify the Chart settings. The correct sequence follows the logical workflow in Azure Synapse Studio: first create the SQL script environment, then write the SELECT query to retrieve sales by product data, execute it to generate results, switch to the Chart view (which only becomes available after query…
Question
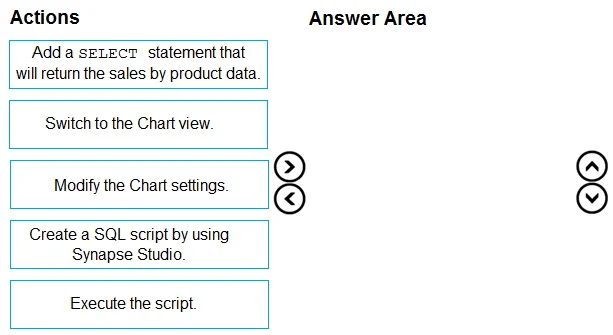
Drag and Drop Question You have an Azure Data Lake Storage account named account1. You use an Azure Synapse Analytics serverless SQL pool to access sales data stored in account1. You need to create a bar chart that displays sales by product. The solution must minimize development effort. In which order should you perform the actions? To answer, move all actions from the list of actions to the answer area and arrange them in the correct order. Answer:
Exhibit
Answer Area
Drag items
Correct arrangement
- Create a SQL script by using Synapse Studio.
- Add a SELECT statement that will return the sales by product data.
- Execute the script.
- Switch to the Chart view.
- Modify the Chart settings.
Explanation
The correct sequence follows the logical workflow in Azure Synapse Studio: first create the SQL script environment, then write the SELECT query to retrieve sales by product data, execute it to generate results, switch to the Chart view (which only becomes available after query execution), and finally adjust the chart settings to configure the bar chart. This approach minimizes development effort by leveraging Synapse Studio's built-in charting capabilities instead of exporting data to an external BI tool like Power BI. You cannot switch to Chart view before executing the query because there are no results to visualize, and you cannot modify chart settings before switching to Chart view.
Topics
Community Discussion
No community discussion yet for this question.