
DATABRICKS-CERTIFIED-PROFESSIONAL-DATA-SCIENTIST · Question #124
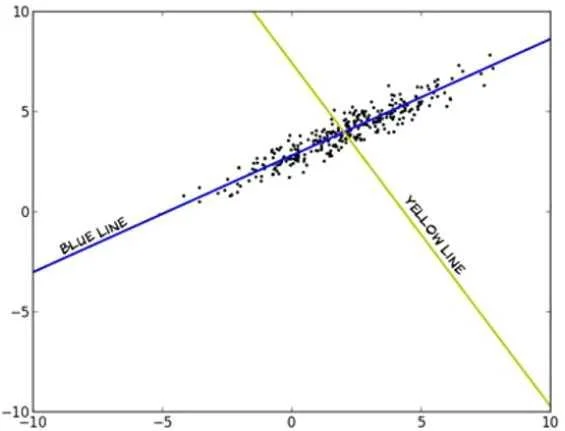
The figure below shows a plot of the data of a data matrix M that is 1000 x 2. Which line represents the first principal component?
The correct answer is B. blue. Principal component analysis (PCA) involves a mathematical procedure that transforms a number of (possibly) correlated variables into a (smaller) number of uncorrelated variables called principal components. The first principal component accounts for as much of the variability…
Question
The figure below shows a plot of the data of a data matrix M that is 1000 x 2. Which line represents the first principal component?
Exhibit
Options
- Ayellow
- Bblue
- CNeither
How the community answered
(35 responses)- A17% (6)
- B71% (25)
- C11% (4)
Explanation
Principal component analysis (PCA) involves a mathematical procedure that transforms a number of (possibly) correlated variables into a (smaller) number of uncorrelated variables called principal components. The first principal component accounts for as much of the variability in the data as possible, and each succeeding component accounts for as much of the remaining variability as possible. The first principal component corresponds to the greatest variance in the data. The blue line is evidently this first principal component, because if we project the data onto the blue line, the data is more spread out (higher variance) than if projected onto any other line, including the
Topics
Community Discussion
No community discussion yet for this question.