CompTIA
DA0-001 · Question #90
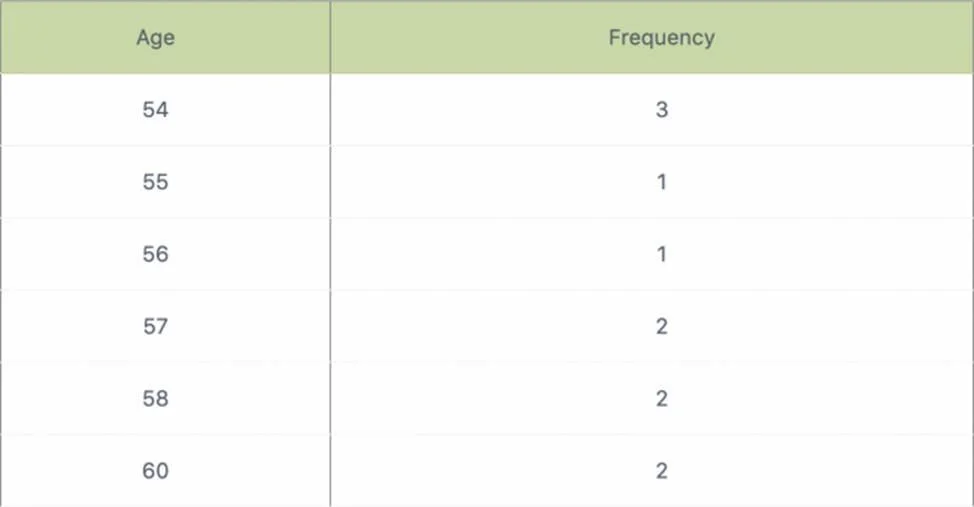
Consider this dataset showing the retirement age of 11 people, in whole years: 54, 54, 54, 55, 56, 57, 57, 58, 58, 60, 60 This tables show a simple frequency distribution of the retirement age data.
Sign in or unlock DA0-001 to reveal the answer and full explanation for question #90. The question stem and answer options stay visible for context.
Data Analysis
Question
Consider this dataset showing the retirement age of 11 people, in whole years:
54, 54, 54, 55, 56, 57, 57, 58, 58, 60, 60 This tables show a simple frequency distribution of the retirement age data.
Exhibit
Options
- A56
- B55
- C57
- D54
Unlock DA0-001 to see the answer
You've previewed enough free DA0-001 questions. Unlock DA0-001 for full answers, explanations, the timed quiz mode, progress tracking, and the master PDF. Question stem and options stay visible so you can still see what's on the exam.
Topics
#Descriptive Statistics#Frequency Distribution#Mode#Data Analysis Fundamentals