
DA0-001 · Question #341
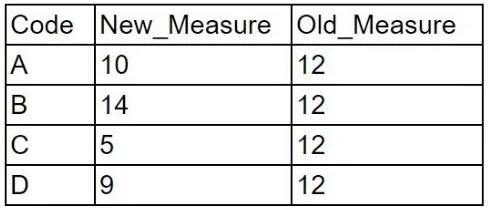
Given the following table: Which of the following methods is the best way to describe the changes in the values in the table?
The correct answer is B. Range. The range is the best method to describe the overall spread or extent of changes in values within a table by identifying the difference between the maximum and minimum values. It provides a simple measure of the total variability.
Question
Given the following table:
Which of the following methods is the best way to describe the changes in the values in the table?
Exhibit
Options
- AAverage
- BRange
- CStandard deviation
- DMedian
How the community answered
(43 responses)- A2% (1)
- B86% (37)
- C7% (3)
- D5% (2)
Why each option
The range is the best method to describe the overall spread or extent of changes in values within a table by identifying the difference between the maximum and minimum values. It provides a simple measure of the total variability.
The average (mean) describes the central tendency of the data, not the changes or spread of values.
The range, calculated as the difference between the maximum and minimum values in a dataset, directly describes the total spread or change observed among the values. This provides a straightforward measure of variability from the lowest to the highest point.
Standard deviation measures the average amount of variability or dispersion around the mean, which is a more complex measure of spread than simply describing the total change.
The median is another measure of central tendency, representing the middle value, not the extent of changes in values.
Concept tested: Descriptive statistics, measures of variability
Source: https://learn.microsoft.com/en-us/azure/architecture/data-guide/big-data/descriptive-analytics
Topics
Community Discussion
No community discussion yet for this question.