
DA0-001 · Question #132
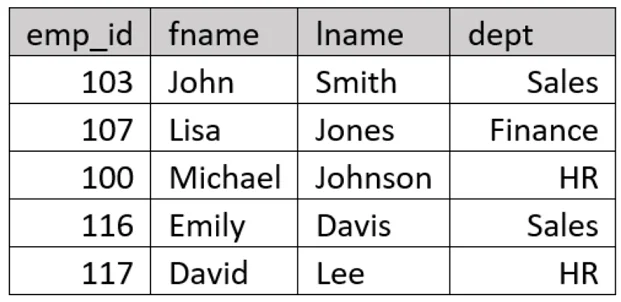
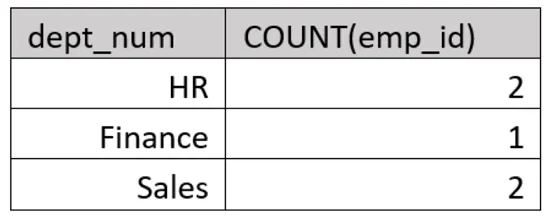
An analyst binds a dashboard item to the data source shown in Exhibit 1. The analyst applies processing that results in the output shown in Exhibit 2. Which of the following statements about this…
The correct answer is D. The analyst has processed the dept column as a dimension. The analyst has processed the dept column as a dimension. Dimensions are used to hold qualitative values, which provide context and help organize the data. They typically represent categories or groupings of data, such as geographic location, time period, or product category…
Question
An analyst binds a dashboard item to the data source shown in Exhibit 1. The analyst applies processing that results in the output shown in Exhibit 2. Which of the following statements about this result is correct?
Exhibits
Options
- AThe analyst has created a stacked chart.
- BThe analyst has performed link analysis for each emp_id.
- CThe analyst has processed the emp_id as a range.
- DThe analyst has processed the dept column as a dimension.
How the community answered
(49 responses)- A6% (3)
- B2% (1)
- C2% (1)
- D90% (44)
Explanation
The analyst has processed the dept column as a dimension. Dimensions are used to hold qualitative values, which provide context and help organize the data. They typically represent categories or groupings of data, such as geographic location, time period, or product category. In this scenario, the employee data in the first set has been categorized by department and the COUNT group function applied. The analyst has not processed the emp_id as a range. In statistics, range is a measure of dispersion that quantifies the spread between a minimum and maximum value. The analyst has not created a stacked chart. A stacked chart is a visual representation of data that displays multiple variables in a single chart by stacking them on top of one another. This allows viewers to see how each variable contributes to the total value of the data set. The analyst has not performed link analysis for each emp_id. Link analysis is used to identify and evaluate relationships between entities in a data set. Link analysis is often visualized using a graph or network, where nodes represent the entities and edges represent the connections
Topics
Community Discussion
No community discussion yet for this question.