
ASQ
CRE · Question #371
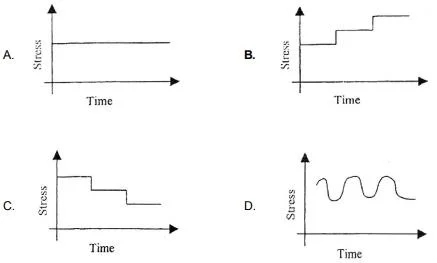
Which of the following graphs represents a product that is undergoing step-stress testing?
The correct answer is B. Option B. You've hit your weekly limit · resets 5am (America/New_York)
Reliability in Testing
Question
Which of the following graphs represents a product that is undergoing step-stress testing?
Exhibit
Options
- AOption A
- BOption B
- COption C
- DOption D
How the community answered
(57 responses)- A2% (1)
- B77% (44)
- C7% (4)
- D14% (8)
Explanation
You've hit your weekly limit · resets 5am (America/New_York)
Topics
#step-stress testing#accelerated testing#stress profile
Community Discussion
No community discussion yet for this question.