
SAP
C_HANAIMP_18 · Question #61
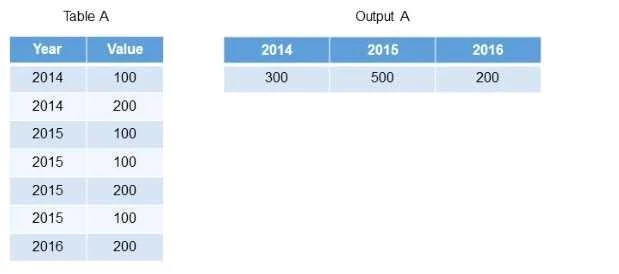
Using the table in the diagram, you need to create a cube calculation view. What is the simplest approach to create the output from the screenshot?
The correct answer is C. Implement a union node and map each year as a separate column. See the full explanation below for the reasoning.
Question
Using the table in the diagram, you need to create a cube calculation view. What is the simplest approach to create the output from the screenshot?
Exhibit
Options
- ACreate 3 calculated columns.
- BCreate a restricted column for each country.
- CImplement a union node and map each year as a separate column.
- DCreate a filter expression that uses an OR operator.
How the community answered
(14 responses)- B7% (1)
- C86% (12)
- D7% (1)
Community Discussion
No community discussion yet for this question.