
IBM
C2020-010 · Question #11
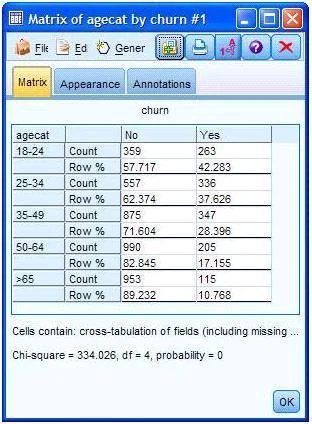
Examine the Matrix table shown below which relates the fields churn (whether a customer will churn) to agecat (Age groups). Based on the table, which statements are accurate? (Choose two.)
The correct answer is A. 42.283% of the 18-24 year olds will churn. C. Older age groups are less likely to churn than the younger ages. See the full explanation below for the reasoning.
Question
Examine the Matrix table shown below which relates the fields churn (whether a customer will churn) to agecat (Age groups). Based on the table, which statements are accurate? (Choose two.)
Exhibit
Options
- A42.283% of the 18-24 year olds will churn.
- B10.768% of those that churn are over 65 years of age.
- COlder age groups are less likely to churn than the younger ages.
- DMeasured by the Chi-square, this is a weak relationship.
How the community answered
(21 responses)- A76% (16)
- B14% (3)
- D10% (2)
Community Discussion
No community discussion yet for this question.