
AZ-400 · Question #89
Drag and Drop Question You have a web app named App1 that is hosted on multiple servers. App1 uses Application Insights in Azure Monitor. You need to compare the daily CPU usage from the last week…
The correct answer is bin(timestamp,1d); render timechart. The query requires 'bin(timestamp,1d)' to group/aggregate CPU usage data into daily buckets (1-day intervals) over the past week, which directly satisfies the 'daily' comparison requirement. 'render timechart' is then used to visualize the results as a time-based chart, and…
Question
Exhibit
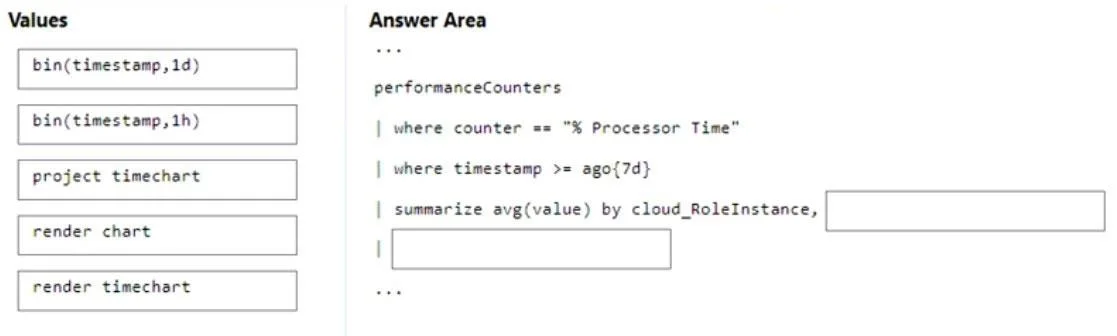
Answer Area
Drag items
Correct arrangement
- bin(timestamp,1d)
- render timechart
Explanation
The query requires 'bin(timestamp,1d)' to group/aggregate CPU usage data into daily buckets (1-day intervals) over the past week, which directly satisfies the 'daily' comparison requirement. 'render timechart' is then used to visualize the results as a time-based chart, and when combined with a 'by Cloud_RoleInstance' or similar split clause, it automatically renders separate series for each server, enabling side-by-side comparison. Together, these two components produce a daily time-series visualization split by server.
Topics
Community Discussion
No community discussion yet for this question.