
AZ-400 · Question #477
Drag and Drop Question You have a project in Azure DevOps. You need to configure a dashboard. The solution must include the following metrics: - Bottlenecks in the software development process - A…
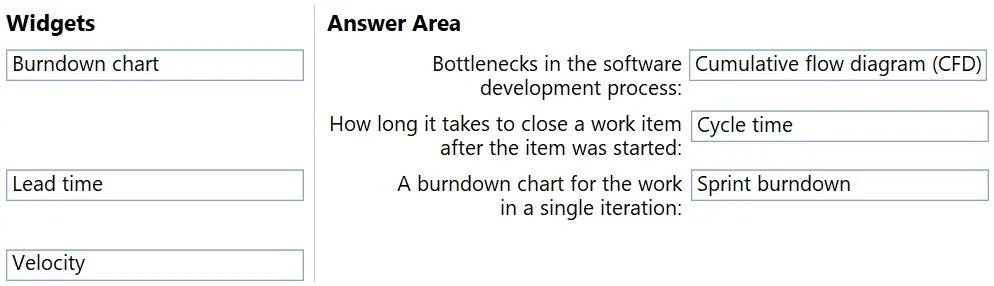
The correct answer is Cumulative flow diagram (CFD); Cycle time; Sprint burndown. The Cumulative Flow Diagram (CFD) visualizes the flow of work across stages over time, making bottlenecks immediately visible as widening bands. The Sprint Burndown widget tracks remaining work within a single iteration (sprint), showing progress toward sprint completion. The…
Question
Exhibit
Answer Area
Drag items
Correct arrangement
- Cumulative flow diagram (CFD)
- Cycle time
- Sprint burndown
Explanation
The Cumulative Flow Diagram (CFD) visualizes the flow of work across stages over time, making bottlenecks immediately visible as widening bands. The Sprint Burndown widget tracks remaining work within a single iteration (sprint), showing progress toward sprint completion. The Cycle Time widget measures the time from when work is actively started to when it is closed, directly matching the requirement of 'how long it takes to close a work item after the item was started.'
Topics
Community Discussion
No community discussion yet for this question.