AZ-400 · Question #401
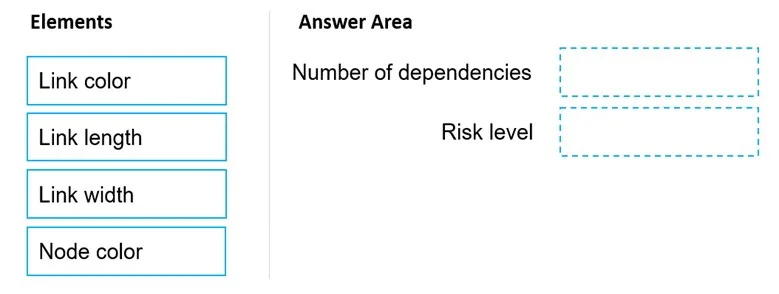
Drag and Drop Question You are using the Dependency Tracker extension in a project in Azure DevOps. You generate a risk graph for the project. What should you use in the risk graph to identify the num
The correct answer is Link width; Link color. In the Azure DevOps Dependency Tracker extension risk graph, Link Width represents the number of dependencies between work items - a thicker link indicates more dependencies exist between nodes. Link Color represents the risk level of those dependencies, where different colors (s
Question
Exhibit
Answer Area
Drag items
Correct arrangement
- Link width
- Link color
Explanation
In the Azure DevOps Dependency Tracker extension risk graph, Link Width represents the number of dependencies between work items - a thicker link indicates more dependencies exist between nodes. Link Color represents the risk level of those dependencies, where different colors (such as red, yellow, green) indicate varying levels of risk (blocked, at risk, or on track). These two visual encodings work together to give teams a quick visual assessment of both dependency volume and health.
Topics
Community Discussion
No community discussion yet for this question.