nerdexam
MicrosoftMicrosoft

AZ-104 · Question #553

AZ-104 Question #553: Real Exam Question with Answer & Explanation

To calculate the distinct count of computers per week and display it as a bar chart, the query requires the summarize operator with dcount and finally the render operator.

Submitted by parkjh· Mar 4, 2026Monitor and back up Azure resources

Question

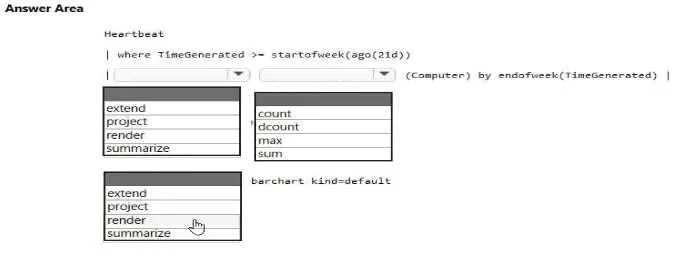
Hotspot Question You need to create a bar chart that shows the number of distinct computers that have sent heartbeats each week. How should you complete the Log Analytics query? To answer, select the appropriate options in the answer area. NOTE; Each correct selection is worth one point. Answer:

Options

  • __typehotspot
  • variantdropdown

Explanation

To calculate the distinct count of computers per week and display it as a bar chart, the query requires the summarize operator with dcount and finally the render operator.

Approach. The question asks to create a bar chart showing the 'number of distinct computers' that have sent heartbeats 'each week'.

  1. First selection (summarize): To aggregate data (like counting distinct items) and group it by a specific period (like 'each week'), the summarize operator is used in KQL. It takes an aggregation function and a by clause for grouping. Since we need dcount(Computer) by endofweek(TimeGenerated), summarize is the correct operator to precede this aggregation.
  2. Second selection (dcount): The requirement is for the 'number of distinct computers'. The dcount() aggregation function is specifically designed to count the number of distinct values in a column. count() would count all entries, not just unique ones. max() and sum() are inappropriate for counting distinct entities.
  3. Third selection (render): The final output needs to be a 'bar chart'. The render operator is used in KQL to visualize query results as various types of charts, including barchart. The kind=default part is a parameter for the render operator.

Therefore, the complete query structure correctly becomes: Heartbeat | where TimeGenerated >= startofweek(ago(21d)) | summarize dcount(Computer) by endofweek(TimeGenerated) | render barchart kind=default.

Common mistakes.

  • common_mistake. 1. Using count instead of dcount: If count was selected, the query would show the total number of heartbeat records for each computer per week, not the number of unique computers. The question explicitly asks for 'distinct computers', making dcount essential.
  1. Using extend or project instead of summarize: extend is used to create new calculated columns, while project is used to select, rename, or reorder columns. Neither of these operators performs aggregation and grouping as required by 'number of distinct computers... each week'. They would result in a syntax error or an incorrect data output that cannot be charted as intended.
  2. Using summarize for the final step instead of render: summarize is an aggregation operator. While it's crucial for the aggregation step, it does not display results as a chart. render is specifically for visualization, making it the only correct choice for generating a bar chart.

Concept tested. Kusto Query Language (KQL) fundamentals, specifically the use of aggregation operators (summarize), aggregation functions (dcount), and visualization operators (render) for time-series analysis in Azure Log Analytics.

Reference. https://learn.microsoft.com/en-us/azure/data-explorer/kusto/query/summarizeoperator, https://learn.microsoft.com/en-us/azure/data-explorer/kusto/query/dcountfunction, https://learn.microsoft.com/en-us/azure/data-explorer/kusto/query/renderoperator

Topics

#Log Analytics#Kusto Query Language#Azure Monitor queries#Data visualization

Community Discussion

No community discussion yet for this question.

Full AZ-104 PracticeBrowse All AZ-104 Questions