
ARA-C01 · Question #149
The Business Intelligence team reports that when some team members run queries for their dashboards in parallel with others, the query response time is getting significantly slower What can a…
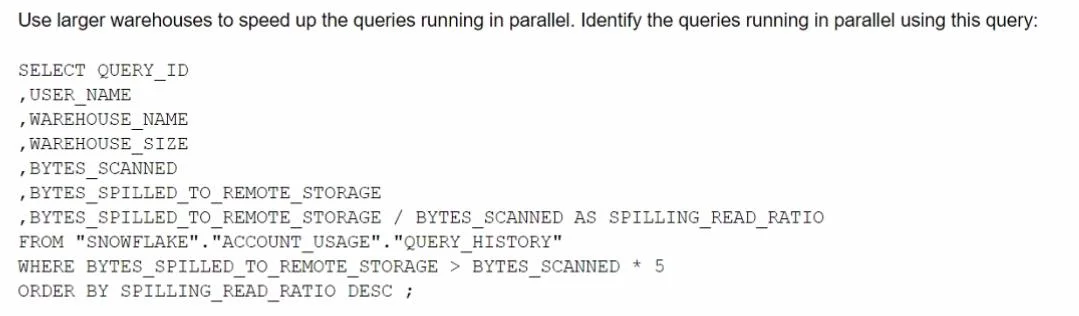
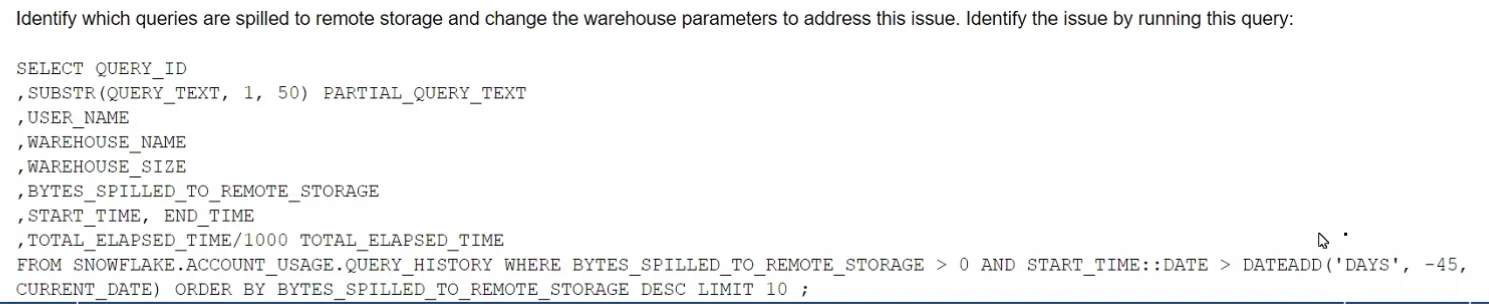
The correct answer is B. Use the QUERY_HISTORY view in the ACCOUNT_USAGE schema to analyze query execution times and identify resource contention, then consider using multi-cluster warehouses to handle concurrent workloads. The symptom - degraded performance specifically when multiple users run queries in parallel - is a classic concurrency/resource contention problem, not a single-query optimization problem. Option B is the most complete and architecturally correct answer: querying…
Question
The Business Intelligence team reports that when some team members run queries for their dashboards in parallel with others, the query response time is getting significantly slower What can a Snowflake Architect do to identify what is occurring and troubleshoot this issue? A. B. C. D.
Exhibits


Options
- AReview the Query Profile in Snowsight to identify bottlenecks and use the AUTO_SUSPEND and AUTO_RESUME features to manage warehouse resources
- BUse the QUERY_HISTORY view in the ACCOUNT_USAGE schema to analyze query execution times and identify resource contention, then consider using multi-cluster warehouses to handle concurrent workloads
- CEnable the Query Acceleration Service for the warehouse and review the WAREHOUSE_METERING_HISTORY to understand usage patterns
- DReview the RESOURCE_MONITOR settings and create separate warehouses for different teams to isolate workloads and prevent resource contention
How the community answered
(32 responses)- A3% (1)
- B84% (27)
- C9% (3)
- D3% (1)
Explanation
The symptom - degraded performance specifically when multiple users run queries in parallel - is a classic concurrency/resource contention problem, not a single-query optimization problem. Option B is the most complete and architecturally correct answer: querying ACCOUNT_USAGE.QUERY_HISTORY lets the architect analyze execution times, queuing times, and cluster utilization across all concurrent sessions to confirm resource contention is the cause. The solution - multi-cluster warehouses - directly addresses concurrency by automatically spinning up additional compute clusters when queued queries exceed a threshold, eliminating the bottleneck. Option A (Query Profile + AUTO_SUSPEND/RESUME) is useful for analyzing individual slow queries, not concurrent workload contention. Option C (Query Acceleration Service) helps accelerate specific large analytical scans, not general concurrent dashboard queries. Option D (separate warehouses per team) is a valid isolation strategy but does not solve the concurrency problem for the 2000+ users within the same team, and RESOURCE_MONITOR is a cost-control tool, not a performance diagnostic tool.
Topics
Community Discussion
No community discussion yet for this question.