Microsoft
AI-900 · Question #12
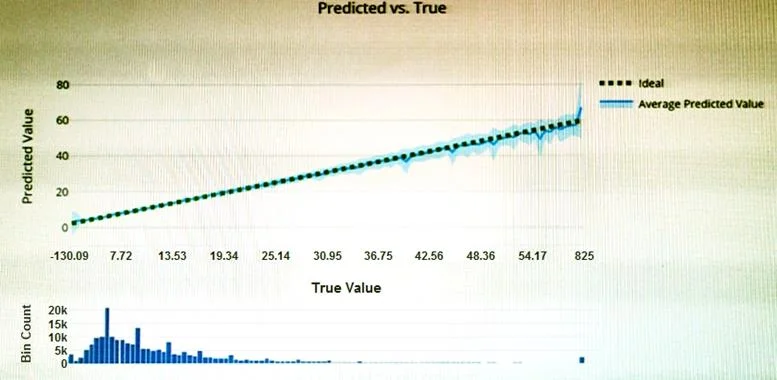
You have the Predicted vs. True chart shown in the following exhibit. Which type of model is the chart used to evaluate?
Sign in or unlock AI-900 to reveal the answer and full explanation for question #12. The question stem and answer options stay visible for context.
Submitted by eva_at· Mar 30, 2026Describe fundamental principles of machine learning on Azure
Question
You have the Predicted vs. True chart shown in the following exhibit. Which type of model is the chart used to evaluate?
Exhibit
Options
- Aclassification
- Bregression
- Cclustering
Unlock AI-900 to see the answer
You've previewed enough free AI-900 questions. Unlock AI-900 for full answers, explanations, the timed quiz mode, progress tracking, and the master PDF. Question stem and options stay visible so you can still see what's on the exam.
Topics
#Model Evaluation#Regression Models#Evaluation Charts