
Aruba
ACCP-V6.2 · Question #103
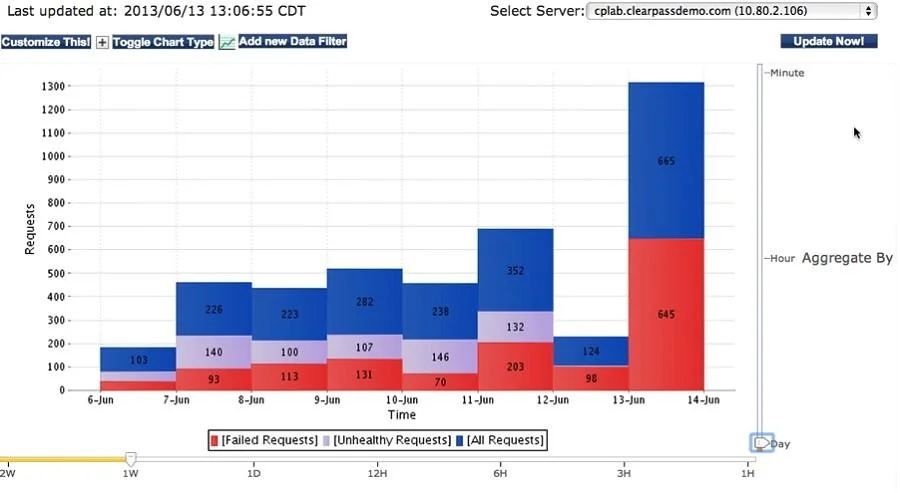
What information can we conclude from the following graph?
Sign in or unlock ACCP-V6.2 to reveal the answer and full explanation for question #103. The question stem and answer options stay visible for context.
Question
What information can we conclude from the following graph?
Exhibit
Options
- AThis graph represents all authentication requests received by Clearpass in one year.
- BThis graph represents all authentication requests received by Clearpass in a day.
- CThe graph represents all authentication requests received by Clearpass in a month.
- DEach bar represents total authentication requests per minute.
- EEach bar represents total authentication requests per day.
Unlock ACCP-V6.2 to see the answer
You've previewed enough free ACCP-V6.2 questions. Unlock ACCP-V6.2 for full answers, explanations, the timed quiz mode, progress tracking, and the master PDF. Question stem and options stay visible so you can still see what's on the exam.