Microsoft
77-427 · Question #29
77-427 Question #29: Real Exam Question with Answer & Explanation
Sign in or unlock 77-427 to reveal the answer and full explanation for question #29. The question stem and answer options stay visible for context.
Question
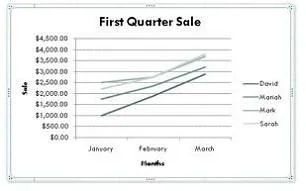
You work as an Office Assistant for Blue Well Inc. The company has a Windows-based network. You are creating a chart in Excel 2013. You want to show the slope of data points in the chart to know the trend of the Business Intelligence data range. Which of the following will you use to accomplish the task?
Exhibit
Options
- ATrendline
- BSparkline
- CBackstage view
- DLine charts
Unlock 77-427 to see the answer
You've previewed enough free 77-427 questions. Unlock 77-427 for full answers, explanations, the timed quiz mode, progress tracking, and the master PDF. Question stem and options stay visible so you can still see what's on the exam.