
500-420 · Question #21
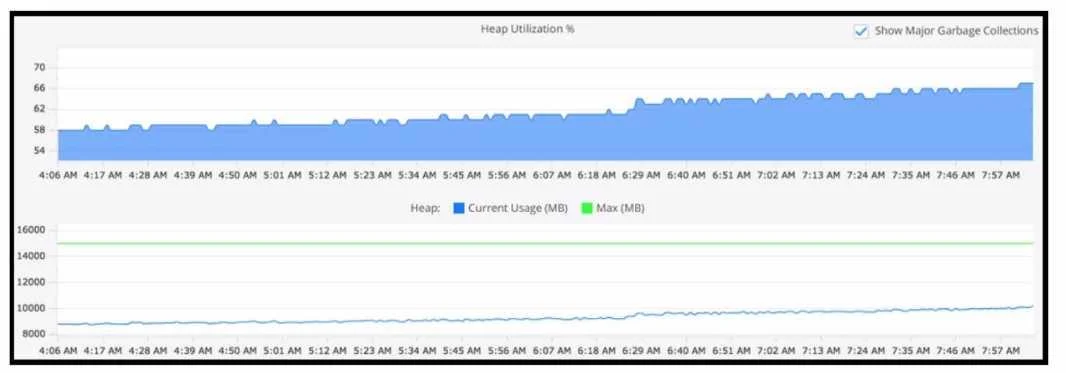
Refer to the exhibit. Using this heap utilization graph, which method is used to confirm if a memory leak is occurring during a certain time frame?
The correct answer is B. Refer to the Tiers and Nodes section and into the Memory tab and visualize Heap Utilization. To confirm if a memory leak is occurring, one should refer to the Tiers and Nodes section of the AppDynamics Controller UI, navigate to the Memory tab, and observe the Heap Utilization over time in relation to the Heap's Current Usage (MB) versus the Maximum (MB) allocated…
Question
Refer to the exhibit. Using this heap utilization graph, which method is used to confirm if a memory leak is occurring during a certain time frame?
Exhibit
Options
- AIn metric browser go through Application Infrastructure > Hardware Resources and select
- BRefer to the Tiers and Nodes section and into the Memory tab and visualize Heap Utilization
- CRefer to the Tiers and Nodes section and into the JMX tab and select JVM > Memory > Heap >
- DIn metric browser go through Application Infrastructure > Hardware Resources > Memory Total
How the community answered
(35 responses)- A6% (2)
- B89% (31)
- C3% (1)
- D3% (1)
Explanation
To confirm if a memory leak is occurring, one should refer to the Tiers and Nodes section of the AppDynamics Controller UI, navigate to the Memory tab, and observe the Heap Utilization over time in relation to the Heap's Current Usage (MB) versus the Maximum (MB) allocated. Consistent growth in heap utilization or an upward trend that does not decrement even after garbage collection indicates a potential memory leak.
Topics
Community Discussion
No community discussion yet for this question.