
300-430 · Question #171
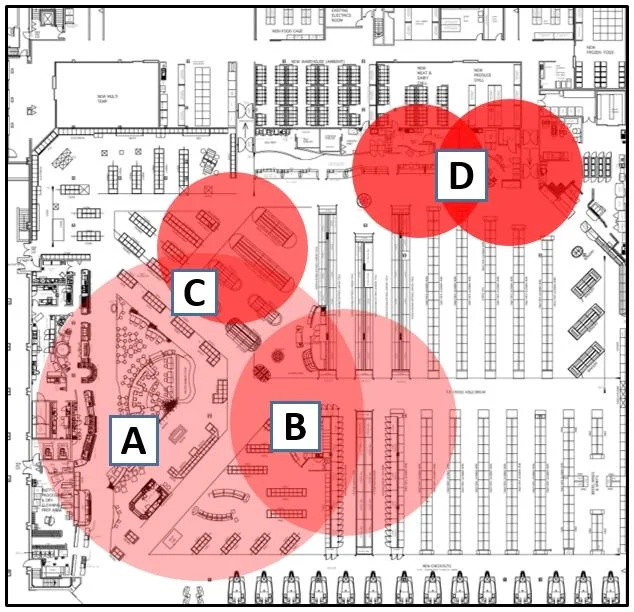
Refer to the exhibit. Which area indicates the greatest impact on the wireless network when viewing the Cisco CleanAir Zone of Impact map of interferers?
The correct answer is D. D. On a Cisco CleanAir Zone of Impact map, the area with the darkest or most intense shading overlay represents the region experiencing the greatest RF interference impact from a detected interferer.
Question
Refer to the exhibit. Which area indicates the greatest impact on the wireless network when viewing the Cisco CleanAir Zone of Impact map of interferers?
Exhibit
Options
- AA
- BB
- CC
- DD
How the community answered
(21 responses)- A5% (1)
- C10% (2)
- D86% (18)
Why each option
On a Cisco CleanAir Zone of Impact map, the area with the darkest or most intense shading overlay represents the region experiencing the greatest RF interference impact from a detected interferer.
Area A on the Zone of Impact map displays lighter shading, representing a lower interference intensity and therefore a less severe impact on wireless operations in that zone.
Area B shows a partial or moderate interference overlay that does not represent the peak impact region visible on the CleanAir map exhibit.
Area C indicates an intermediate level of RF interference severity that is less concentrated and less impactful than the zone represented by area D.
The Cisco CleanAir Zone of Impact map uses graduated color overlays to visualize interference severity radiating from a detected RF interferer. Area D displays the darkest or most concentrated shading, indicating the highest level of RF degradation in that zone. Wireless clients or APs located within area D experience the most significant performance impact from the interfering device.
Concept tested: Cisco CleanAir Zone of Impact map interpretation
Source: https://www.cisco.com/c/en/us/td/docs/wireless/controller/8-5/config-guide/b_cg85/cleanair.html
Topics
Community Discussion
No community discussion yet for this question.