
2V0-622D · Question #204
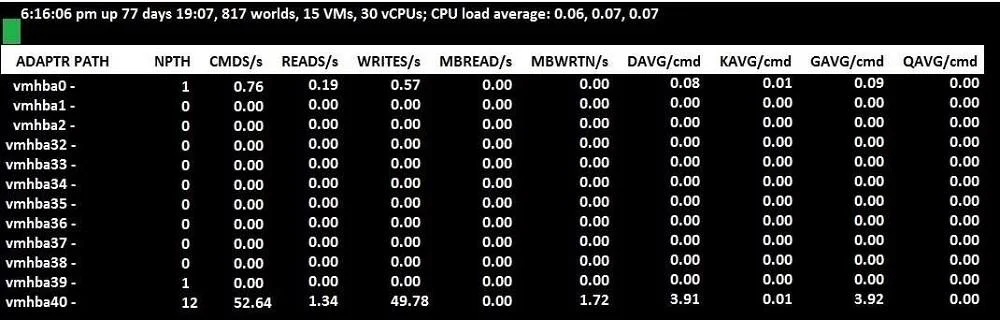
Which metric in the Exhibit would identify high latency for a storage device?
The correct answer is B. DAVG/cmd. The esxtop storage latency metrics distinguish between where latency originates, and DAVG specifically isolates the physical device response time.
Question
Which metric in the Exhibit would identify high latency for a storage device?
Exhibit
Options
- AKAVG/cmd
- BDAVG/cmd
- CGAVG/cmd
- DQAVG/cmd
How the community answered
(44 responses)- A5% (2)
- B91% (40)
- C2% (1)
- D2% (1)
Why each option
The esxtop storage latency metrics distinguish between where latency originates, and DAVG specifically isolates the physical device response time.
KAVG/cmd reflects latency introduced by the VMkernel storage stack itself, not the physical storage device.
DAVG/cmd (Device Average latency per command) measures the time in milliseconds that the physical storage device takes to process an I/O request, making it the definitive indicator of high latency at the storage hardware level.
GAVG/cmd is the sum of DAVG and KAVG, representing total guest-observed latency - it does not isolate device-level latency specifically.
QAVG/cmd measures time an I/O request spends waiting in the VMkernel queue before being dispatched, which reflects scheduling delays rather than device performance.
Concept tested: esxtop storage latency metric interpretation
Source: https://docs.vmware.com/en/VMware-vSphere/8.0/vsphere-monitoring-performance/GUID-2A3A952C-4B8F-4B85-9B2C-B1C1F4F1E6EB.html
Topics
Community Discussion
No community discussion yet for this question.