
1Z0-146 · Question #46
In a user session, tracing is enabled as follows: SQL> EXECUTE. DBMS_TRACE.SET_PLSQL_TRACE(DBMS_TRACE.TRACE_ENABLED_LINES); PL/SQL procedure successfully completed. You executed the procedure as…
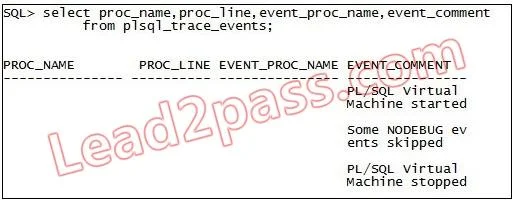
The correct answer is B. The PROC10 procedure is not compiled with the DEBUG option. https://docs.oracle.com/cd/B28359_01/appdev.111/b28419/d_trace.htm#i1002144 Two levels of line tracing are available: Level 1: Trace all lines. This corresponds to the constant TRACE_ALL_LINES. Level 2: Trace lines in enabled program units only. This corresponds to the constant…
Question
In a user session, tracing is enabled as follows:
SQL> EXECUTE. DBMS_TRACE.SET_PLSQL_TRACE(DBMS_TRACE.TRACE_ENABLED_LINES); PL/SQL procedure successfully completed. You executed the procedure as follows:
SQL> EXECUTE PROC10 PL/SQL procedure successfully completed. When you examine the PLSQL_TRACE_EVENTS table, you find that no trace information was written into it. View the Exhibit. What is the reason for this?
Exhibit
Options
- AThe PROC10 procedure is created with the invoker's right.
- BThe PROC10 procedure is not compiled with the DEBUG option.
- CTracing is not enabled with the TRACE_ENABLED_CALLS option.
- DThe TRACE_ENABLED parameter is set to FALSE for the session.
How the community answered
(51 responses)- A14% (7)
- B75% (38)
- C8% (4)
- D4% (2)
Explanation
https://docs.oracle.com/cd/B28359_01/appdev.111/b28419/d_trace.htm#i1002144 Two levels of line tracing are available: Level 1: Trace all lines. This corresponds to the constant TRACE_ALL_LINES. Level 2: Trace lines in enabled program units only. This corresponds to the constant TRACE_ENABLED_LINES." "Controlling Data Volume Profiling large applications may produce a large volume of data. You can control the volume of data collected by enabling specific program units for trace data collection. You can enable a program unit by compiling it debug."
Topics
Community Discussion
No community discussion yet for this question.